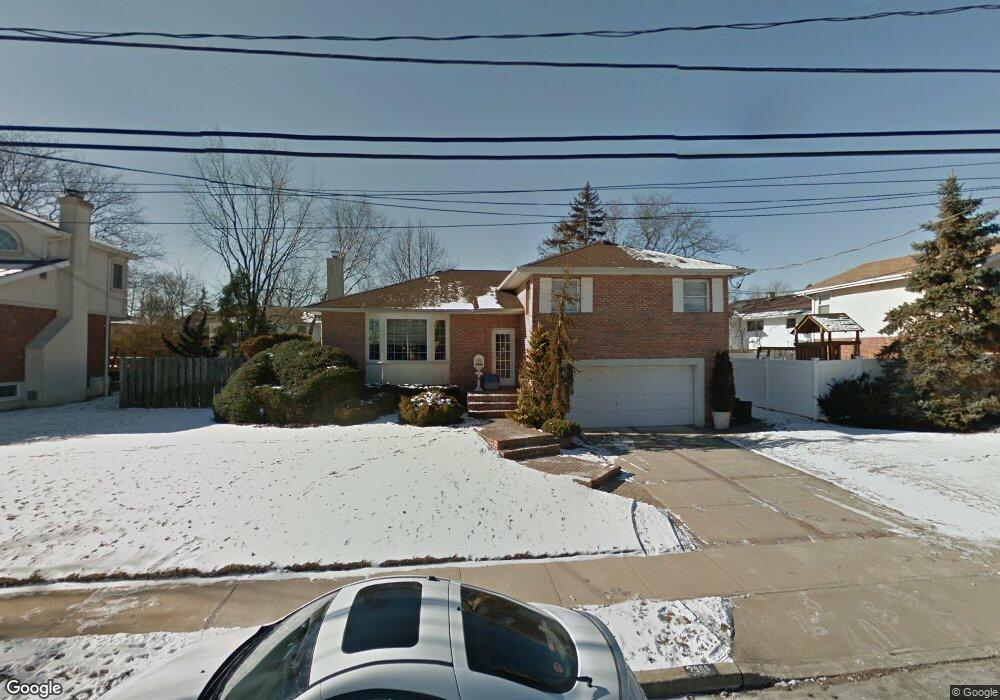
2906 Shore Dr Merrick, NY 11566
Estimated Value: $1,011,891 - $1,037,000
3
Beds
3
Baths
1,580
Sq Ft
$648/Sq Ft
Est. Value
About This Home
This home is located at 2906 Shore Dr, Merrick, NY 11566 and is currently estimated at $1,024,446, approximately $648 per square foot. 2906 Shore Dr is a home located in Nassau County with nearby schools including Burcham Elementary School, Merrick Avenue Middle School, and John F. Kennedy High School.
Ownership History
Date
Name
Owned For
Owner Type
Purchase Details
Closed on
Jan 14, 2019
Sold by
Demarco Jean
Bought by
Pierce Ann Marie
Current Estimated Value
Home Financials for this Owner
Home Financials are based on the most recent Mortgage that was taken out on this home.
Original Mortgage
$130,000
Outstanding Balance
$114,297
Interest Rate
4.6%
Mortgage Type
New Conventional
Estimated Equity
$910,150
Purchase Details
Closed on
Aug 4, 2010
Sold by
Demarco Charles and Demarco Jean
Bought by
Demarco Jean
Create a Home Valuation Report for This Property
The Home Valuation Report is an in-depth analysis detailing your home's value as well as a comparison with similar homes in the area
Home Values in the Area
Average Home Value in this Area
Purchase History
| Date | Buyer | Sale Price | Title Company |
|---|---|---|---|
| Pierce Ann Marie | $675,000 | None Available | |
| Demarco Jean | -- | -- |
Source: Public Records
Mortgage History
| Date | Status | Borrower | Loan Amount |
|---|---|---|---|
| Open | Pierce Ann Marie | $130,000 |
Source: Public Records
Tax History Compared to Growth
Tax History
| Year | Tax Paid | Tax Assessment Tax Assessment Total Assessment is a certain percentage of the fair market value that is determined by local assessors to be the total taxable value of land and additions on the property. | Land | Improvement |
|---|---|---|---|---|
| 2025 | $17,454 | $576 | $280 | $296 |
| 2024 | $4,204 | $600 | $292 | $308 |
| 2023 | $18,042 | $633 | $308 | $325 |
| 2022 | $18,042 | $678 | $330 | $348 |
| 2021 | $27,235 | $649 | $286 | $363 |
| 2020 | $19,569 | $989 | $824 | $165 |
| 2019 | $4,599 | $989 | $824 | $165 |
| 2018 | $4,388 | $989 | $0 | $0 |
| 2017 | $11,380 | $989 | $824 | $165 |
| 2016 | $15,612 | $989 | $824 | $165 |
| 2015 | $3,925 | $989 | $609 | $380 |
| 2014 | $3,925 | $989 | $609 | $380 |
| 2013 | $3,714 | $989 | $609 | $380 |
Source: Public Records
Map
Nearby Homes