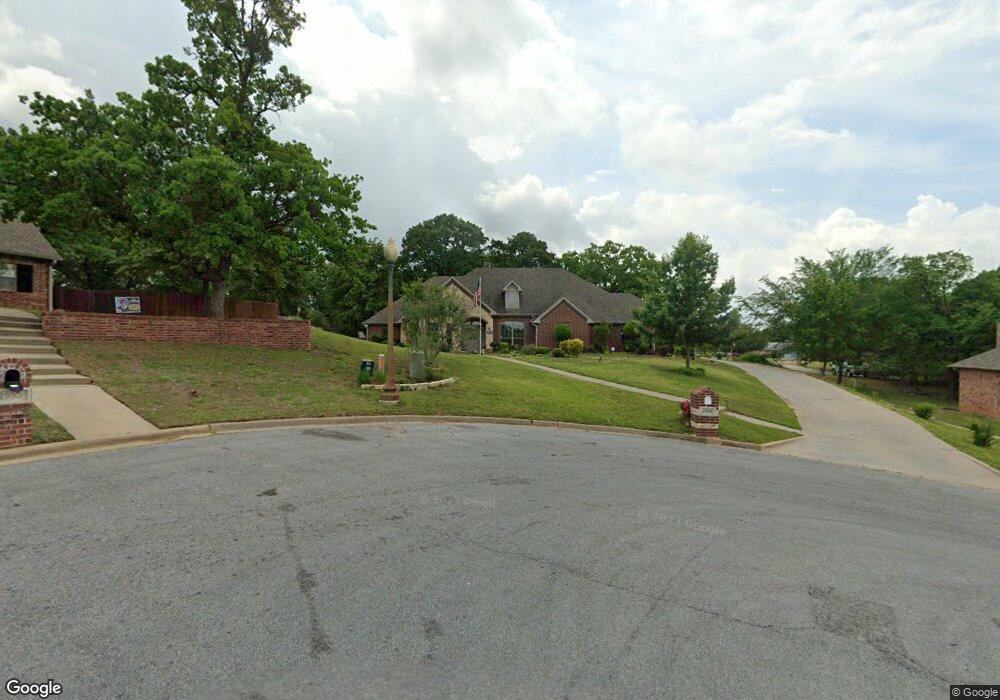
2906 Village Cir Denison, TX 75020
Estimated Value: $398,131 - $496,000
3
Beds
3
Baths
2,522
Sq Ft
$177/Sq Ft
Est. Value
About This Home
This home is located at 2906 Village Cir, Denison, TX 75020 and is currently estimated at $447,066, approximately $177 per square foot. 2906 Village Cir is a home located in Grayson County with nearby schools including Hyde Park Elementary School, Scott Middle School, and Denison High School.
Ownership History
Date
Name
Owned For
Owner Type
Purchase Details
Closed on
Jul 21, 2016
Sold by
Skaggs James R and Skaggs Karla D
Bought by
Thomas Stanley Gene and Thomas Cynthia Lynne
Current Estimated Value
Home Financials for this Owner
Home Financials are based on the most recent Mortgage that was taken out on this home.
Original Mortgage
$70,000
Outstanding Balance
$6,841
Interest Rate
3.6%
Mortgage Type
New Conventional
Estimated Equity
$440,225
Purchase Details
Closed on
Aug 23, 2006
Sold by
Village Green Of Denison Inc
Bought by
Skaggs James R and Skaggs Karla D
Home Financials for this Owner
Home Financials are based on the most recent Mortgage that was taken out on this home.
Original Mortgage
$24,300
Interest Rate
6.72%
Mortgage Type
Stand Alone Second
Purchase Details
Closed on
Jan 17, 2006
Sold by
Taylor Delbert and Taylor Pat
Bought by
Village Green Of Denison Inc
Create a Home Valuation Report for This Property
The Home Valuation Report is an in-depth analysis detailing your home's value as well as a comparison with similar homes in the area
Home Values in the Area
Average Home Value in this Area
Purchase History
| Date | Buyer | Sale Price | Title Company |
|---|---|---|---|
| Thomas Stanley Gene | -- | Red River Title Co | |
| Skaggs James R | -- | Grayson County Title | |
| Village Green Of Denison Inc | -- | None Available |
Source: Public Records
Mortgage History
| Date | Status | Borrower | Loan Amount |
|---|---|---|---|
| Open | Thomas Stanley Gene | $70,000 | |
| Previous Owner | Skaggs James R | $24,300 | |
| Previous Owner | Skaggs James R | $194,400 |
Source: Public Records
Tax History Compared to Growth
Tax History
| Year | Tax Paid | Tax Assessment Tax Assessment Total Assessment is a certain percentage of the fair market value that is determined by local assessors to be the total taxable value of land and additions on the property. | Land | Improvement |
|---|---|---|---|---|
| 2025 | $3,841 | $413,902 | $90,164 | $323,738 |
| 2024 | $9,301 | $400,329 | $0 | $0 |
| 2023 | $3,791 | $363,935 | $0 | $0 |
| 2022 | $7,861 | $330,850 | $0 | $0 |
| 2021 | $7,586 | $300,773 | $50,203 | $250,570 |
| 2020 | $7,824 | $296,597 | $38,154 | $258,443 |
| 2019 | $7,913 | $287,566 | $38,154 | $249,412 |
| 2018 | $7,587 | $273,497 | $31,728 | $241,769 |
| 2017 | $7,127 | $254,764 | $29,318 | $225,446 |
| 2016 | $6,481 | $231,664 | $21,626 | $210,038 |
| 2015 | $5,244 | $221,078 | $23,902 | $197,176 |
| 2014 | $5,759 | $219,441 | $23,902 | $195,539 |
Source: Public Records
Map
Nearby Homes
- 2914 Village Cir
- 14 Lillis Park Cir
- TBD 3 S Lillis Ln
- TBD 2 S Lillis Ln
- 1417 Morrison Dr
- 1421 S Lillis Ln
- 1601 S Lillis Ln
- 1800 W Crawford St
- 922 S Hyde Park Ave
- 12 Village Green Ct
- 44 Haven Cir
- 813 Glen Key St
- 000 Stafford Dr
- 800 Glen Key St
- 2408 Debra Ave
- 631 Kerby Dr
- 22 Haven Cir
- 16 Haven Cir
- 2014 Jerry Ave
- 3430 W Crawford St
- 2900 Village Cir
- 11 Lillis Park Cir
- 2910 Village Cir
- 2905 Village Cir
- 10 Lillis Park Cir
- 2909 Village Cir
- 12 Lillis Park Cir
- 1403 Morrison Dr
- 2920 Village Cir
- 9 Lillis Park Cir
- 2915 Village Cir
- 13 Lillis Park Cir
- 2906 Greenwood Cir
- 2900 Greenwood Cir
- 1405 Morrison Dr
- 2921 Village Cir
- 2926 Village Cir
- 8 Lillis Park Cir
- 1402 Morrison Dr
- 1407 Morrison Dr