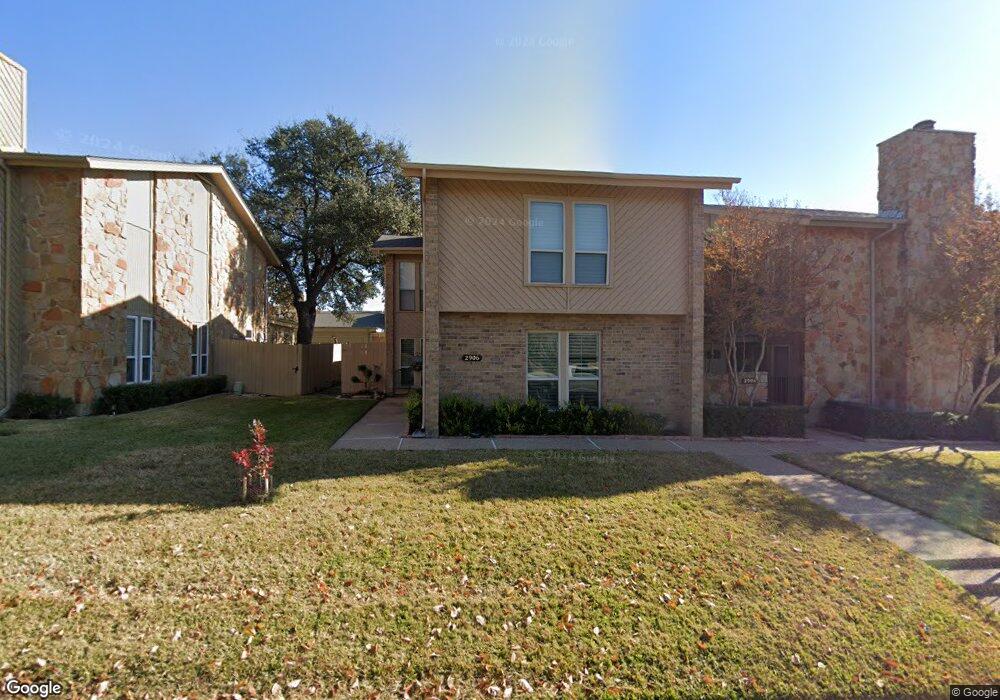
2906 Wayside Dr Bedford, TX 76021
Estimated Value: $283,802 - $295,000
2
Beds
2
Baths
1,729
Sq Ft
$168/Sq Ft
Est. Value
About This Home
This home is located at 2906 Wayside Dr, Bedford, TX 76021 and is currently estimated at $290,701, approximately $168 per square foot. 2906 Wayside Dr is a home located in Tarrant County with nearby schools including Bedford Heights Elementary School, Bedford Junior High School, and L.D. Bell High School.
Ownership History
Date
Name
Owned For
Owner Type
Purchase Details
Closed on
Sep 5, 2014
Sold by
Hundle Lennie Norine
Bought by
Gehl Nina M
Current Estimated Value
Home Financials for this Owner
Home Financials are based on the most recent Mortgage that was taken out on this home.
Original Mortgage
$107,200
Outstanding Balance
$82,099
Interest Rate
4.15%
Mortgage Type
New Conventional
Estimated Equity
$208,602
Purchase Details
Closed on
Apr 7, 2006
Sold by
Hundle Lennie Norine
Bought by
Hundle Lennie Norine
Purchase Details
Closed on
Feb 20, 2004
Sold by
Hundle Stacy Lynn
Bought by
Hundle Bill C and Hundle Lennie N
Purchase Details
Closed on
Jul 28, 2003
Sold by
Hundle Bill C and Hundle Lennie N
Bought by
Hundle Stacy Lynn
Purchase Details
Closed on
Apr 27, 2000
Sold by
Hundle Bill C and Hundle Lennie N
Bought by
Hundle Stacy Lynn
Create a Home Valuation Report for This Property
The Home Valuation Report is an in-depth analysis detailing your home's value as well as a comparison with similar homes in the area
Home Values in the Area
Average Home Value in this Area
Purchase History
| Date | Buyer | Sale Price | Title Company |
|---|---|---|---|
| Gehl Nina M | -- | None Available | |
| Hundle Lennie Norine | -- | None Available | |
| Hundle Bill C | $100,000 | -- | |
| Hundle Stacy Lynn | -- | -- | |
| Hundle Stacy Lynn | -- | -- | |
| Hundle Stacy Lynn | -- | -- |
Source: Public Records
Mortgage History
| Date | Status | Borrower | Loan Amount |
|---|---|---|---|
| Open | Gehl Nina M | $107,200 |
Source: Public Records
Tax History Compared to Growth
Tax History
| Year | Tax Paid | Tax Assessment Tax Assessment Total Assessment is a certain percentage of the fair market value that is determined by local assessors to be the total taxable value of land and additions on the property. | Land | Improvement |
|---|---|---|---|---|
| 2025 | $978 | $237,750 | $55,000 | $182,750 |
| 2024 | $978 | $293,482 | $55,000 | $238,482 |
| 2023 | $4,695 | $275,556 | $35,000 | $240,556 |
| 2022 | $4,861 | $222,547 | $35,000 | $187,547 |
| 2021 | $4,956 | $232,380 | $35,000 | $197,380 |
| 2020 | $4,548 | $192,555 | $35,000 | $157,555 |
| 2019 | $4,225 | $198,063 | $35,000 | $163,063 |
| 2018 | $1,990 | $158,085 | $35,000 | $123,085 |
| 2017 | $3,477 | $145,472 | $35,000 | $110,472 |
| 2016 | $3,161 | $130,649 | $35,000 | $95,649 |
| 2015 | $1,715 | $124,400 | $3,360 | $121,040 |
| 2014 | $1,715 | $124,400 | $3,360 | $121,040 |
Source: Public Records
Map
Nearby Homes
- 432 Sunnybrook Ct
- 320 Blue Quail Ct
- 817 Shady Lake Dr
- 3213 Spring Valley Dr
- 121 Kay Ct
- 3119 Spring Grove Dr
- 124 Jeannie Ct
- 801 Shady Creek Ln
- 1732 Jeannie Ln
- 1740 Brown Trail
- 305 Warbler Dr
- 2436 Brookgreen Ct
- 922 Shady Creek Ln
- 913 Kensington Ct
- 2420 Stonegate Dr N
- 1013 Springdale Rd
- 405 Woodbriar Ct
- 3605 Spring Valley Dr
- 2704 Shady Grove Dr
- 100 Hillview Ct
- 2904 Wayside Dr
- 2908 Wayside Dr
- 2910 Wayside Dr
- 2902 Wayside Dr
- 2900 Wayside Dr
- 2905 Oak Shadow Cir
- 2907 Oak Shadow Cir
- 2907 Oak Shadows Cir
- 2909 Oak Shadow Cir
- 2903 Oak Shadow Cir
- 2901 Oak Shadow Cir
- 232 Wayside Ct
- 228 Wayside Ct
- 303 Oak Shadow Cir
- 301 Oak Shadow Cir
- 305 Oak Shadow Cir
- 307 Oak Shadow Cir
- 309 Oak Shadow Cir
- 311 Oak Shadow Cir
- 224 Wayside Ct