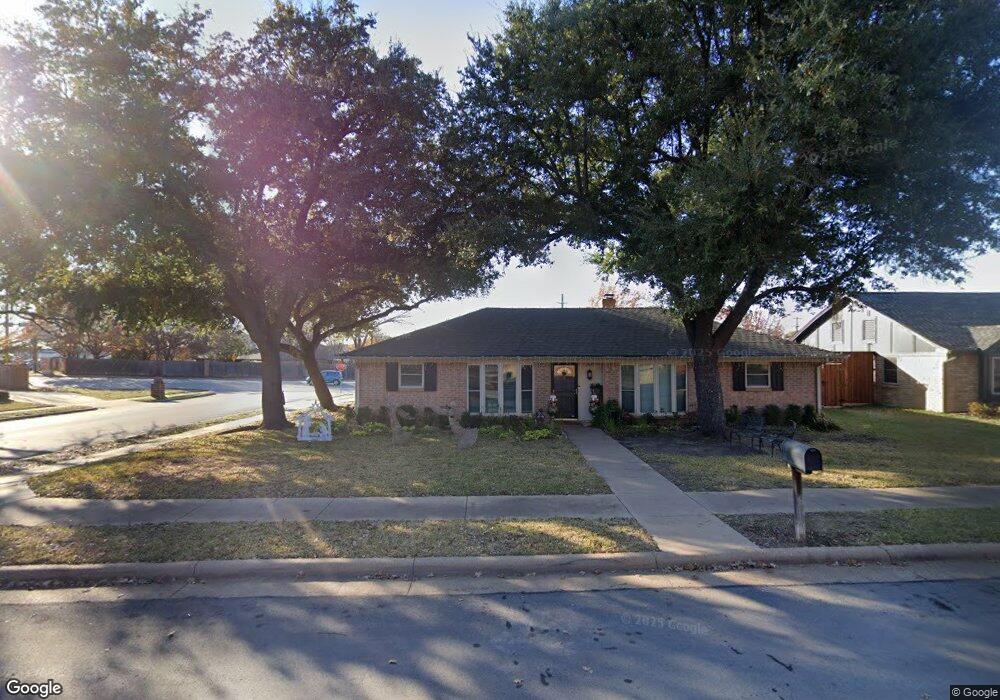
2907 Post Oak Ct Bedford, TX 76021
Estimated Value: $355,000 - $374,000
4
Beds
2
Baths
1,606
Sq Ft
$227/Sq Ft
Est. Value
About This Home
This home is located at 2907 Post Oak Ct, Bedford, TX 76021 and is currently estimated at $364,448, approximately $226 per square foot. 2907 Post Oak Ct is a home located in Tarrant County with nearby schools including Spring Garden Elementary School, Harwood Junior High School, and Trinity High School.
Ownership History
Date
Name
Owned For
Owner Type
Purchase Details
Closed on
Apr 24, 2013
Sold by
Stewart Robin M and Standley Robin M
Bought by
Stewart Robin M
Current Estimated Value
Purchase Details
Closed on
Dec 18, 2006
Sold by
Sogan Joseph P and Sogan Marci L
Bought by
Standley Robin M
Home Financials for this Owner
Home Financials are based on the most recent Mortgage that was taken out on this home.
Original Mortgage
$90,000
Outstanding Balance
$53,809
Interest Rate
6.31%
Mortgage Type
Purchase Money Mortgage
Estimated Equity
$310,639
Purchase Details
Closed on
Mar 12, 1997
Sold by
Henry Haskell W
Bought by
Sogan Joseph P and Sogan Marci L
Home Financials for this Owner
Home Financials are based on the most recent Mortgage that was taken out on this home.
Original Mortgage
$82,771
Interest Rate
7.74%
Mortgage Type
FHA
Create a Home Valuation Report for This Property
The Home Valuation Report is an in-depth analysis detailing your home's value as well as a comparison with similar homes in the area
Home Values in the Area
Average Home Value in this Area
Purchase History
| Date | Buyer | Sale Price | Title Company |
|---|---|---|---|
| Stewart Robin M | -- | Chicago Title Insurance Comp | |
| Standley Robin M | -- | Riahcrd M Kilgore Title Svcs | |
| Sogan Joseph P | -- | Rattikin Title Co |
Source: Public Records
Mortgage History
| Date | Status | Borrower | Loan Amount |
|---|---|---|---|
| Open | Standley Robin M | $90,000 | |
| Previous Owner | Sogan Joseph P | $82,771 |
Source: Public Records
Tax History Compared to Growth
Tax History
| Year | Tax Paid | Tax Assessment Tax Assessment Total Assessment is a certain percentage of the fair market value that is determined by local assessors to be the total taxable value of land and additions on the property. | Land | Improvement |
|---|---|---|---|---|
| 2025 | $6,996 | $359,363 | $75,000 | $284,363 |
| 2024 | $6,996 | $359,363 | $75,000 | $284,363 |
| 2023 | $6,137 | $319,953 | $45,000 | $274,953 |
| 2022 | $6,022 | $275,729 | $45,000 | $230,729 |
| 2021 | $5,703 | $242,120 | $45,000 | $197,120 |
| 2020 | $5,330 | $224,155 | $45,000 | $179,155 |
| 2019 | $5,482 | $225,655 | $45,000 | $180,655 |
| 2018 | $5,041 | $207,507 | $45,000 | $162,507 |
| 2017 | $4,689 | $193,813 | $35,000 | $158,813 |
| 2016 | $4,187 | $173,089 | $35,000 | $138,089 |
| 2015 | $3,599 | $156,574 | $35,000 | $121,574 |
| 2014 | $3,599 | $143,300 | $25,000 | $118,300 |
Source: Public Records
Map
Nearby Homes
- 1630 Post Oak Dr
- 2901 Miles Way
- 37 Devonshire Dr
- 1704 Indian Oaks Ct
- 1636 Bedford Oaks Dr
- 1723 Post Oak Dr
- 1401 Danielle Dr
- 22 Lincolnshire Cir
- 1601 Warwickshire Ct W
- 2524 Shady Ridge Dr
- 2503 Shady Ridge Dr
- 2508 Lakeview Dr
- 2704 Shady Grove Dr
- 1800 Hampton Dr
- 2700 Shady Grove Dr
- 2112 Oakmeadow Place
- 3301 Wendover Ct
- 3532 Meadowside Dr
- 1013 Springdale Rd
- 2109 Oakmeadow St
- 2911 Post Oak Ct
- 1600 Post Oak Dr
- 2908 Post Oak Ct
- 1604 Post Oak Dr
- 2912 Post Oak Ct
- 2915 Post Oak Ct
- 2904 Miles Way
- 1608 Post Oak Dr
- 1428 Sylvia Dr
- 2908 Miles Way
- 2916 Post Oak Ct
- 1612 Post Oak Dr
- 2907 Spring Oaks Ct
- 2911 Spring Oaks Ct
- 2912 Miles Way
- 2919 Post Oak Ct
- 1424 Sylvia Dr
- 2915 Spring Oaks Ct
- 2905 Miles Way
- 1616 Post Oak Dr