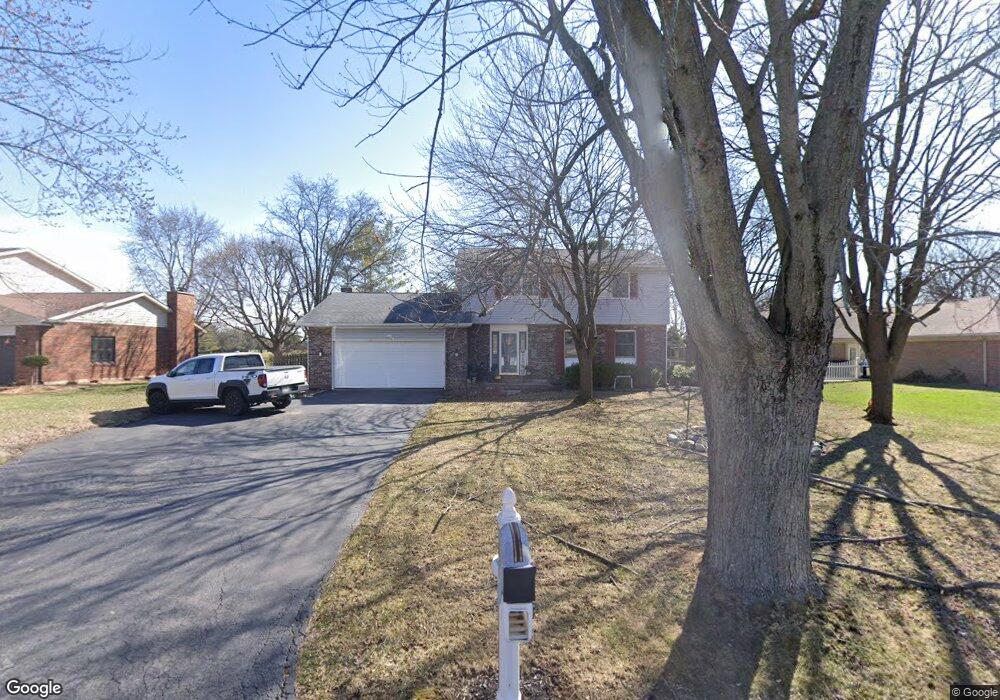
2907 Saint Andrews Dr Findlay, OH 45840
Estimated Value: $314,000 - $368,000
4
Beds
3
Baths
2,322
Sq Ft
$146/Sq Ft
Est. Value
About This Home
This home is located at 2907 Saint Andrews Dr, Findlay, OH 45840 and is currently estimated at $338,268, approximately $145 per square foot. 2907 Saint Andrews Dr is a home located in Hancock County with nearby schools including Liberty-Benton Elementary School, Liberty-Benton Middle School, and Liberty-Benton High School.
Ownership History
Date
Name
Owned For
Owner Type
Purchase Details
Closed on
Sep 14, 2012
Sold by
Mcadoo Steven J
Bought by
Greer Corey and Greer Miranda
Current Estimated Value
Home Financials for this Owner
Home Financials are based on the most recent Mortgage that was taken out on this home.
Original Mortgage
$187,540
Outstanding Balance
$130,075
Interest Rate
3.62%
Mortgage Type
FHA
Estimated Equity
$208,193
Purchase Details
Closed on
Apr 25, 2001
Sold by
Favors Stephen M
Bought by
Mcadoo Steven J and Mcadoo Gina S
Home Financials for this Owner
Home Financials are based on the most recent Mortgage that was taken out on this home.
Original Mortgage
$165,600
Interest Rate
7.03%
Mortgage Type
New Conventional
Purchase Details
Closed on
Aug 3, 1992
Bought by
Favor Stephen M and Favor Donna J
Purchase Details
Closed on
Jul 14, 1989
Bought by
Hade Thomas B and Hade Brenda K
Purchase Details
Closed on
May 23, 1988
Bought by
Hooper Hooper J and Hooper Suzanne
Purchase Details
Closed on
Apr 25, 1985
Bought by
Charnes Clifton B
Purchase Details
Closed on
Jul 2, 1984
Bought by
Equitable Relocation
Create a Home Valuation Report for This Property
The Home Valuation Report is an in-depth analysis detailing your home's value as well as a comparison with similar homes in the area
Home Values in the Area
Average Home Value in this Area
Purchase History
| Date | Buyer | Sale Price | Title Company |
|---|---|---|---|
| Greer Corey | $191,000 | Mid Am Title Agency | |
| Mcadoo Steven J | $184,000 | -- | |
| Favor Stephen M | $139,000 | -- | |
| Hade Thomas B | $131,000 | -- | |
| Hooper Hooper J | $129,000 | -- | |
| Charnes Clifton B | $81,000 | -- | |
| Equitable Relocation | -- | -- |
Source: Public Records
Mortgage History
| Date | Status | Borrower | Loan Amount |
|---|---|---|---|
| Open | Greer Corey | $187,540 | |
| Closed | Mcadoo Steven J | $165,600 |
Source: Public Records
Tax History Compared to Growth
Tax History
| Year | Tax Paid | Tax Assessment Tax Assessment Total Assessment is a certain percentage of the fair market value that is determined by local assessors to be the total taxable value of land and additions on the property. | Land | Improvement |
|---|---|---|---|---|
| 2024 | $3,449 | $92,790 | $10,130 | $82,660 |
| 2023 | $3,368 | $92,790 | $10,130 | $82,660 |
| 2022 | $3,335 | $92,790 | $10,130 | $82,660 |
| 2021 | $3,151 | $77,390 | $10,140 | $67,250 |
| 2020 | $3,178 | $77,390 | $10,140 | $67,250 |
| 2019 | $3,049 | $77,390 | $10,140 | $67,250 |
| 2018 | $2,402 | $67,310 | $8,820 | $58,490 |
| 2017 | $2,478 | $67,310 | $8,820 | $58,490 |
| 2016 | $2,401 | $67,120 | $8,820 | $58,300 |
| 2015 | $2,272 | $62,060 | $8,820 | $53,240 |
| 2014 | $2,293 | $62,060 | $8,820 | $53,240 |
| 2012 | $2,175 | $56,340 | $8,820 | $47,520 |
Source: Public Records
Map
Nearby Homes
- 3018 Gleneagle Dr
- 933 Laurel Ln
- 1310 Muirfield Dr
- 3106 Saddlebrook
- 1405 Cypress Lake
- 6535 Silver Lake Dr
- 925 W Melrose Ave
- 615 Hillcrest Ave
- 905 W Melrose Ave
- 3300 Crosshill Dr
- 506 Hillcrest Ave
- 643 Edith Ave
- 0 County Road 95 Unit 6097574
- 0 Township Highway 99
- 12325 Township Highway 99
- 126 Hillcrest Ave
- 0 Allen Township 142
- 0 County Road 140
- 304 Prentiss Ave
- 3239 N Main St
- 1020 Inverness Dr
- 2915 Saint Andrews Dr
- 1006 Inverness Dr
- 2906 Saint Andrews Dr
- 1102 Inverness Dr
- 2912 Saint Andrews Dr
- 1000 Inverness Dr
- 2811 Saint Andrews Dr
- 1015 Inverness Dr
- 2918 Saint Andrews Dr
- 2927 Saint Andrews Dr
- 1007 Inverness Dr
- 1101 Inverness Dr
- 2924 Saint Andrews Dr
- 1112 Inverness Dr
- 2929 St Andrews Dr
- 1001 Inverness Dr
- 1107 Inverness Dr
- 2929 Saint Andrews Dr
- 2805 Saint Andrews Dr