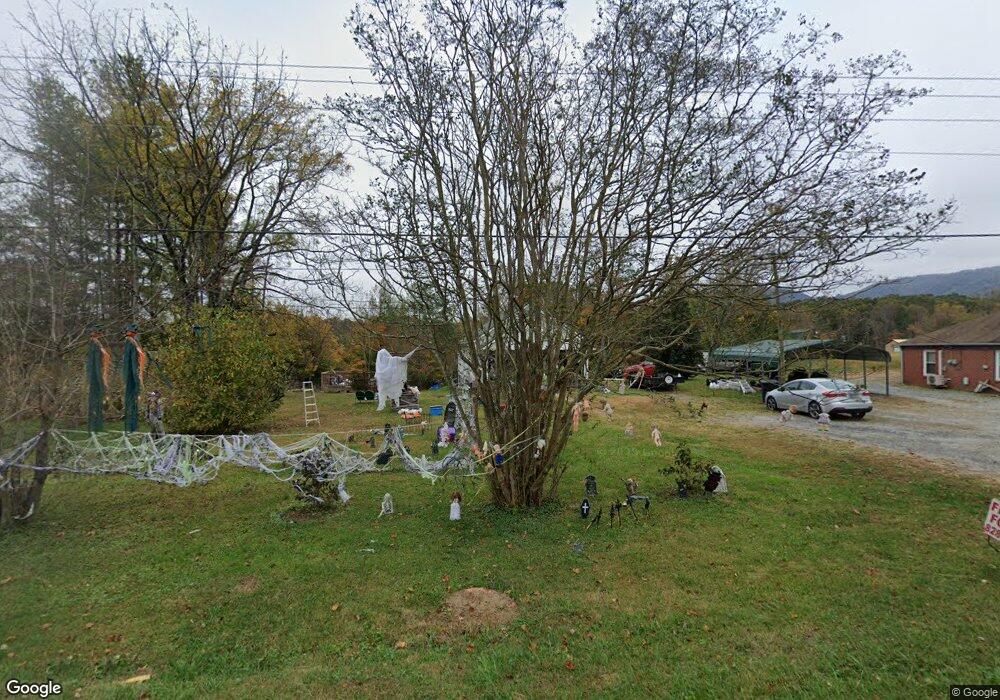
2907 Us 64 Morganton, NC 28655
Estimated Value: $198,000 - $226,000
3
Beds
1
Bath
1,168
Sq Ft
$182/Sq Ft
Est. Value
About This Home
This home is located at 2907 Us 64, Morganton, NC 28655 and is currently estimated at $212,870, approximately $182 per square foot. 2907 Us 64 is a home located in Burke County with nearby schools including Salem Elementary School, Liberty Middle School, and Robert L. Patton High School.
Ownership History
Date
Name
Owned For
Owner Type
Purchase Details
Closed on
May 19, 2016
Sold by
Anderson Cynthia Anne
Bought by
Morris Timothy O and Morris Rhea A
Current Estimated Value
Home Financials for this Owner
Home Financials are based on the most recent Mortgage that was taken out on this home.
Original Mortgage
$88,369
Outstanding Balance
$70,187
Interest Rate
3.59%
Mortgage Type
FHA
Estimated Equity
$142,683
Purchase Details
Closed on
Nov 17, 2010
Sold by
Williams Inez Causby and Williams Jack
Bought by
Anderson Cynthia Anne
Home Financials for this Owner
Home Financials are based on the most recent Mortgage that was taken out on this home.
Original Mortgage
$52,520
Interest Rate
4.33%
Mortgage Type
FHA
Purchase Details
Closed on
Aug 18, 2010
Sold by
Causby James Christopher
Bought by
Causby James Christopher
Purchase Details
Closed on
Oct 29, 2008
Sold by
Causby James Christopher
Bought by
Causby Jean G
Create a Home Valuation Report for This Property
The Home Valuation Report is an in-depth analysis detailing your home's value as well as a comparison with similar homes in the area
Home Values in the Area
Average Home Value in this Area
Purchase History
| Date | Buyer | Sale Price | Title Company |
|---|---|---|---|
| Morris Timothy O | $90,000 | Attorney | |
| Anderson Cynthia Anne | $65,000 | None Available | |
| Causby James Christopher | -- | None Available | |
| Causby Jean G | -- | None Available |
Source: Public Records
Mortgage History
| Date | Status | Borrower | Loan Amount |
|---|---|---|---|
| Open | Morris Timothy O | $88,369 | |
| Previous Owner | Anderson Cynthia Anne | $52,520 |
Source: Public Records
Tax History
| Year | Tax Paid | Tax Assessment Tax Assessment Total Assessment is a certain percentage of the fair market value that is determined by local assessors to be the total taxable value of land and additions on the property. | Land | Improvement |
|---|---|---|---|---|
| 2025 | $1,044 | $145,317 | $27,664 | $117,653 |
| 2024 | $1,006 | $145,317 | $27,664 | $117,653 |
| 2023 | $1,006 | $145,317 | $27,664 | $117,653 |
| 2022 | $660 | $72,731 | $19,914 | $52,817 |
| 2021 | $632 | $72,731 | $19,914 | $52,817 |
| 2020 | $628 | $72,731 | $19,914 | $52,817 |
| 2019 | $628 | $72,731 | $19,914 | $52,817 |
| 2018 | $622 | $71,946 | $19,915 | $52,031 |
| 2017 | $620 | $71,946 | $19,915 | $52,031 |
| 2016 | $532 | $62,724 | $19,915 | $42,809 |
| 2015 | $529 | $62,724 | $19,915 | $42,809 |
| 2014 | $528 | $62,724 | $19,915 | $42,809 |
| 2013 | $528 | $62,724 | $19,915 | $42,809 |
Source: Public Records
Map
Nearby Homes
- 00 Paul Shuping Ave
- 0 Paul Shuping Ave
- 1940 Paul Shuping Ave
- 2522 Saratoga Run
- 2490 Saratoga Run
- 4314 Belmont Dr
- 2301 Saratoga Run
- 4390 Belmont Dr
- 2153 S Fork Dr
- 4331 Acorn Trace
- 4391 Boulder Dr Unit 20
- 1321 Birch Dr
- 4582 Burkemont Rd
- 0 Burkemont Rd Unit CAR4247417
- 307 Salem Rd
- 5451 Burkemont Rd
- 206 Beacon Ave
- 204 Beacon Ave
- 110 Garrison Rd
- 1320 Burkemont Ave