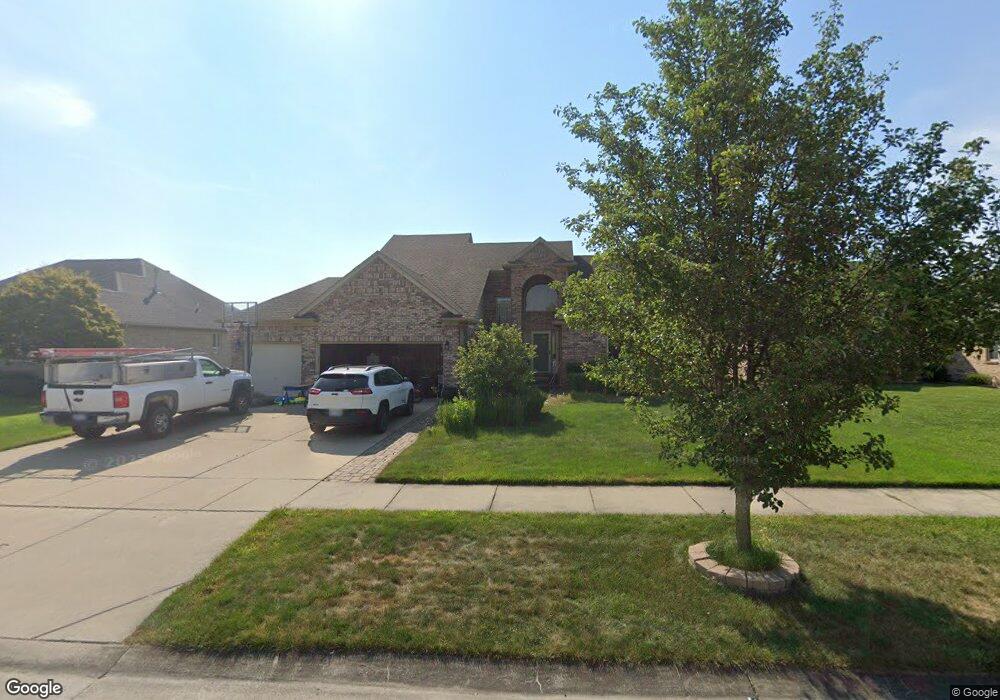
29077 Merrimade Ln Chesterfield, MI 48047
Estimated Value: $432,000 - $505,000
3
Beds
3
Baths
2,250
Sq Ft
$206/Sq Ft
Est. Value
About This Home
This home is located at 29077 Merrimade Ln, Chesterfield, MI 48047 and is currently estimated at $462,499, approximately $205 per square foot. 29077 Merrimade Ln is a home located in Macomb County with nearby schools including Dean A. Naldrett School, Anchor Bay Middle School South, and Anchor Bay High School.
Ownership History
Date
Name
Owned For
Owner Type
Purchase Details
Closed on
May 22, 2008
Sold by
Va
Bought by
Shain Kristina A
Current Estimated Value
Home Financials for this Owner
Home Financials are based on the most recent Mortgage that was taken out on this home.
Original Mortgage
$190,018
Outstanding Balance
$121,153
Interest Rate
6.01%
Mortgage Type
FHA
Estimated Equity
$341,346
Purchase Details
Closed on
Apr 30, 2007
Sold by
Flagstar Bank Fsb
Bought by
Va
Purchase Details
Closed on
Apr 13, 2007
Sold by
Gardner Alvin
Bought by
Flagstar Bank Fsb
Purchase Details
Closed on
Sep 2, 2005
Sold by
White William B and White Patricia A
Bought by
Garner Alvin and Moore Brenda
Purchase Details
Closed on
Nov 20, 2000
Sold by
Coppa Building Co Inc
Bought by
White William B
Purchase Details
Closed on
Jun 30, 1999
Sold by
Baycourt Development Llc
Bought by
Coppa Building Co Inc
Create a Home Valuation Report for This Property
The Home Valuation Report is an in-depth analysis detailing your home's value as well as a comparison with similar homes in the area
Home Values in the Area
Average Home Value in this Area
Purchase History
| Date | Buyer | Sale Price | Title Company |
|---|---|---|---|
| Shain Kristina A | -- | Andover Title & Escrow Agenc | |
| Va | -- | None Available | |
| Flagstar Bank Fsb | $239,714 | None Available | |
| Garner Alvin | $300,000 | The Title Company Of Mi Inc | |
| White William B | $60,000 | -- | |
| Coppa Building Co Inc | $53,000 | -- |
Source: Public Records
Mortgage History
| Date | Status | Borrower | Loan Amount |
|---|---|---|---|
| Open | Shain Kristina A | $190,018 |
Source: Public Records
Tax History Compared to Growth
Tax History
| Year | Tax Paid | Tax Assessment Tax Assessment Total Assessment is a certain percentage of the fair market value that is determined by local assessors to be the total taxable value of land and additions on the property. | Land | Improvement |
|---|---|---|---|---|
| 2025 | $4,994 | $216,000 | $0 | $0 |
| 2024 | $2,820 | $198,700 | $0 | $0 |
| 2023 | $2,673 | $186,500 | $0 | $0 |
| 2022 | $4,528 | $156,200 | $0 | $0 |
| 2021 | $4,412 | $144,500 | $0 | $0 |
| 2020 | $2,456 | $139,300 | $0 | $0 |
| 2019 | $4,089 | $130,800 | $0 | $0 |
| 2018 | $3,986 | $126,500 | $17,600 | $108,900 |
| 2017 | $3,941 | $120,500 | $17,600 | $102,900 |
| 2016 | $3,935 | $120,500 | $0 | $0 |
| 2015 | $1,889 | $113,800 | $0 | $0 |
| 2014 | $1,889 | $104,250 | $12,250 | $92,000 |
| 2012 | -- | $0 | $0 | $0 |
Source: Public Records
Map
Nearby Homes
- 29371 Bayside Cir N
- 29213 Rachid Ln
- 47460 Sugarbush Rd
- 29126 Brooke Meadows Ct
- 47812 Forbes Dr
- 47685 Jefferson Ave
- 29705 Alexandra Ln Unit 13
- 29401 Wand Dr
- 47031 Jefferson Ave
- 47900 Jefferson Ave
- 47935 Remington Ct
- 28490 Cotton Rd Unit 3
- 47978 Jefferson Ave
- 000 Farwell St
- 29050 Farwell St
- 28715 Portsmouth Ct Unit 32
- 28734 Yarmouth Ct Unit 18
- 00000 21 Mile Rd
- 48323 Whittington Dr
- 48093 Forbes St
- 29073 Merrimade Ln
- 29081 Merrimade Ln
- 47621 Clairmont Ln
- 47619 Clairmont Ln
- 29069 Merrimade Ln
- 47623 Clairmont Ln
- 29076 Merrimade Ln
- 29080 Merrimade Ln
- 29072 Merrimade Ln
- 47625 Clairmont Ln
- 29065 Merrimade Ln
- 29062 Bay Pointe Dr
- 29058 Bay Pointe Dr
- 29068 Merrimade Ln
- 29066 Bay Pointe Dr
- 47627 Clairmont Ln
- 29054 Bay Pointe Dr
- 29047 Bay Pointe Dr
- 29070 Bay Pointe Dr
- 47622 Clairmont Ln