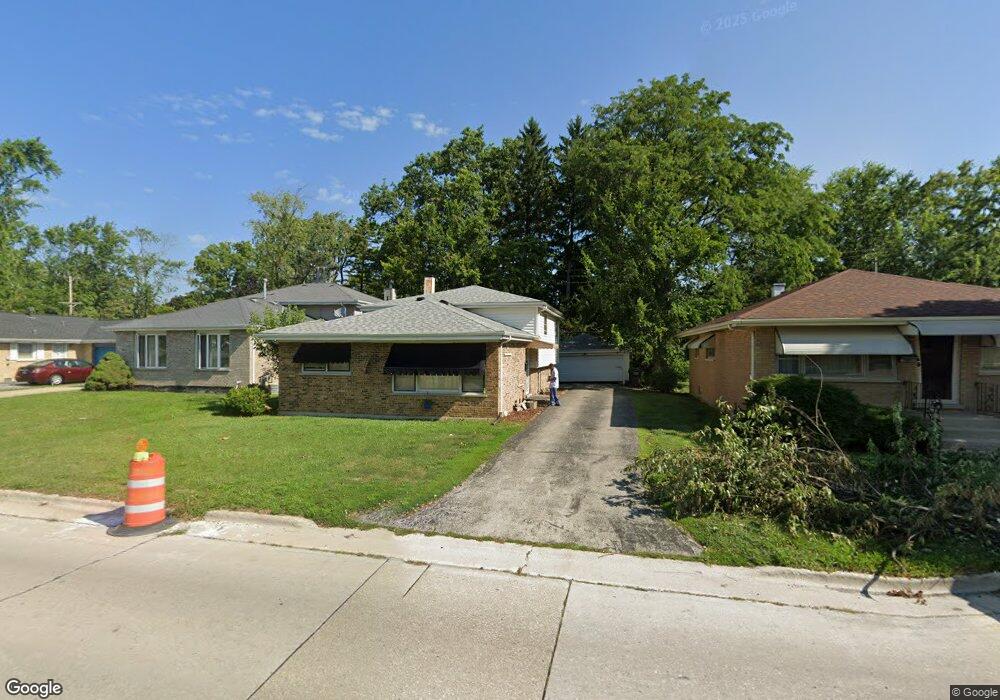
2908 175th St Hazel Crest, IL 60429
Estimated Value: $157,808 - $238,000
3
Beds
1
Bath
1,217
Sq Ft
$166/Sq Ft
Est. Value
About This Home
This home is located at 2908 175th St, Hazel Crest, IL 60429 and is currently estimated at $201,952, approximately $165 per square foot. 2908 175th St is a home located in Cook County with nearby schools including Mae Jemison School, Prairie-Hills Junior High School, and Hillcrest High School.
Ownership History
Date
Name
Owned For
Owner Type
Purchase Details
Closed on
Sep 20, 2006
Sold by
Brown Joe
Bought by
Brown Tonya Byrd
Current Estimated Value
Purchase Details
Closed on
Jun 20, 2006
Sold by
Brown Joe
Bought by
Byrd Brown Tonya
Purchase Details
Closed on
Mar 22, 2004
Sold by
Brown Carrie
Bought by
Brown Joseph and Byrd Brown Tonya
Purchase Details
Closed on
Oct 31, 2001
Sold by
Standard Bank & Trust Company
Bought by
Brown Carrie
Home Financials for this Owner
Home Financials are based on the most recent Mortgage that was taken out on this home.
Original Mortgage
$128,700
Interest Rate
10.99%
Purchase Details
Closed on
Oct 1, 1996
Sold by
Budlove William S
Bought by
Kristie Mitchell
Purchase Details
Closed on
Nov 5, 1993
Sold by
W B Construction
Bought by
Budlove William S
Create a Home Valuation Report for This Property
The Home Valuation Report is an in-depth analysis detailing your home's value as well as a comparison with similar homes in the area
Home Values in the Area
Average Home Value in this Area
Purchase History
| Date | Buyer | Sale Price | Title Company |
|---|---|---|---|
| Brown Tonya Byrd | -- | None Available | |
| Byrd Brown Tonya | -- | None Available | |
| Brown Joseph | -- | -- | |
| Brown Carrie | $133,000 | First American Title | |
| Kristie Mitchell | $7,000 | Chicago Title Insurance Co | |
| Budlove William S | -- | -- | |
| W B Construction Company | $5,333 | -- |
Source: Public Records
Mortgage History
| Date | Status | Borrower | Loan Amount |
|---|---|---|---|
| Previous Owner | Brown Carrie | $128,700 |
Source: Public Records
Tax History Compared to Growth
Tax History
| Year | Tax Paid | Tax Assessment Tax Assessment Total Assessment is a certain percentage of the fair market value that is determined by local assessors to be the total taxable value of land and additions on the property. | Land | Improvement |
|---|---|---|---|---|
| 2024 | $8,035 | $19,001 | $1,788 | $17,213 |
| 2023 | $6,263 | $19,001 | $1,788 | $17,213 |
| 2022 | $6,263 | $11,953 | $1,513 | $10,440 |
| 2021 | $6,100 | $11,951 | $1,512 | $10,439 |
| 2020 | $5,944 | $11,951 | $1,512 | $10,439 |
| 2019 | $5,081 | $11,017 | $1,375 | $9,642 |
| 2018 | $4,919 | $11,017 | $1,375 | $9,642 |
| 2017 | $4,632 | $11,017 | $1,375 | $9,642 |
| 2016 | $4,752 | $10,625 | $1,237 | $9,388 |
| 2015 | $4,482 | $10,625 | $1,237 | $9,388 |
| 2014 | $4,401 | $10,625 | $1,237 | $9,388 |
| 2013 | $4,871 | $12,800 | $1,237 | $11,563 |
Source: Public Records
Map
Nearby Homes
- 2900 175th St
- 2912 175th St
- 2814 Lexington Dr
- 2810 Lexington Dr
- 17410 Emerson Ave
- 3003 Longfellow Ave
- 2818 Tennyson Place
- 17405 Longfellow Ave
- 3107 Longfellow Ave
- 7 E Carriageway Dr Unit 311
- 3004 Longfellow Ave
- 5 E Carriageway Dr Unit 210
- 17613 Grandview Dr
- 2722 Cherrywood Ln
- 17622 Oakwood Dr
- 17504 Danielle Ct
- 2711 Larkspur Ln
- 2805 Knollwood Place
- 17303 Kedzie Ave
- 2612 175th St
- 2910 175th St
- 2904 175th St
- 17409 Holmes Ave
- 2902 175th St
- 2909 Lexington Dr
- 2907 Lexington Dr
- 17411 Holmes Ave
- 2905 Lexington Dr
- 2903 Lexington Dr
- 17405 Holmes Ave
- 17403 Holmes Ave
- 17418 Holmes Ave
- 17416 Holmes Ave
- 17427 Lowell Ave
- 17414 Holmes Ave
- 17414 Holmes Ave
- 2902 Lexington Dr
- 2900 Lexington Dr
- 3004 175th St