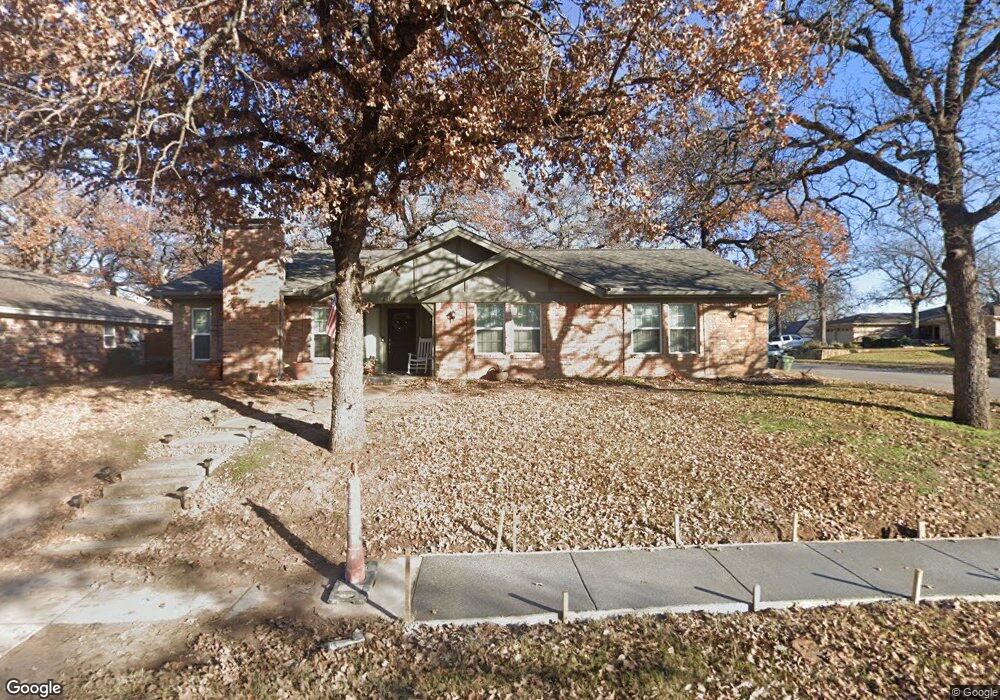
2908 Spring Oaks Ct Bedford, TX 76021
Estimated Value: $385,000 - $411,308
3
Beds
2
Baths
1,671
Sq Ft
$237/Sq Ft
Est. Value
About This Home
This home is located at 2908 Spring Oaks Ct, Bedford, TX 76021 and is currently estimated at $396,577, approximately $237 per square foot. 2908 Spring Oaks Ct is a home located in Tarrant County with nearby schools including Spring Garden Elementary School, Harwood Junior High School, and Trinity High School.
Ownership History
Date
Name
Owned For
Owner Type
Purchase Details
Closed on
Sep 12, 2017
Sold by
Mostyn Winslow Realty Investments Llc
Bought by
Bereuter Erin L
Current Estimated Value
Home Financials for this Owner
Home Financials are based on the most recent Mortgage that was taken out on this home.
Original Mortgage
$242,250
Outstanding Balance
$202,459
Interest Rate
3.93%
Mortgage Type
New Conventional
Estimated Equity
$194,118
Purchase Details
Closed on
Mar 21, 2017
Sold by
Taylor David Cody and Taylor Anna
Bought by
Mostyn Winslow Realty Investments Llc
Home Financials for this Owner
Home Financials are based on the most recent Mortgage that was taken out on this home.
Original Mortgage
$25,000
Interest Rate
4.17%
Mortgage Type
Purchase Money Mortgage
Purchase Details
Closed on
Dec 9, 1985
Sold by
Wallace J B and Wallace Bobbie Lee
Bought by
Barfield & Arnold Builders Inc
Create a Home Valuation Report for This Property
The Home Valuation Report is an in-depth analysis detailing your home's value as well as a comparison with similar homes in the area
Home Values in the Area
Average Home Value in this Area
Purchase History
| Date | Buyer | Sale Price | Title Company |
|---|---|---|---|
| Bereuter Erin L | -- | Capital Title | |
| Mostyn Winslow Realty Investments Llc | -- | None Available | |
| Barfield & Arnold Builders Inc | -- | -- | |
| Barfield John W | -- | Trinity Western Title Co |
Source: Public Records
Mortgage History
| Date | Status | Borrower | Loan Amount |
|---|---|---|---|
| Open | Bereuter Erin L | $242,250 | |
| Previous Owner | Mostyn Winslow Realty Investments Llc | $25,000 |
Source: Public Records
Tax History Compared to Growth
Tax History
| Year | Tax Paid | Tax Assessment Tax Assessment Total Assessment is a certain percentage of the fair market value that is determined by local assessors to be the total taxable value of land and additions on the property. | Land | Improvement |
|---|---|---|---|---|
| 2025 | $5,708 | $487,196 | $75,000 | $412,196 |
| 2024 | $5,708 | $487,196 | $75,000 | $412,196 |
| 2023 | $6,266 | $441,098 | $45,000 | $396,098 |
| 2022 | $6,487 | $315,000 | $45,000 | $270,000 |
| 2021 | $6,360 | $270,000 | $45,000 | $225,000 |
| 2020 | $6,420 | $270,000 | $45,000 | $225,000 |
| 2019 | $6,710 | $286,218 | $45,000 | $241,218 |
| 2018 | $5,718 | $251,099 | $45,000 | $206,099 |
| 2017 | $4,302 | $193,749 | $35,000 | $158,749 |
| 2016 | $3,911 | $173,089 | $35,000 | $138,089 |
| 2015 | $3,080 | $158,203 | $35,000 | $123,203 |
| 2014 | $3,080 | $133,600 | $25,000 | $108,600 |
Source: Public Records
Map
Nearby Homes
- 1630 Post Oak Dr
- 1704 Indian Oaks Ct
- 1636 Bedford Oaks Dr
- 37 Devonshire Dr
- 1723 Post Oak Dr
- 2901 Miles Way
- 1401 Danielle Dr
- 22 Lincolnshire Cir
- 1601 Warwickshire Ct W
- 2524 Shady Ridge Dr
- 1800 Hampton Dr
- 2503 Shady Ridge Dr
- 2112 Oakmeadow Place
- 3532 Meadowside Dr
- 2508 Lakeview Dr
- 2109 Oakmeadow St
- 2704 Shady Grove Dr
- 3301 Wendover Ct
- 2700 Shady Grove Dr
- 3513 Meadowside Dr
- 2912 Spring Oaks Ct
- 2907 Tangle Oaks Ct
- 2911 Tangle Oaks Ct
- 2907 Spring Oaks Ct
- 1624 Post Oak Dr
- 2916 Spring Oaks Ct
- 1620 Post Oak Dr
- 2911 Spring Oaks Ct
- 1628 Post Oak Dr
- 2915 Tangle Oaks Ct
- 1616 Post Oak Dr
- 2915 Spring Oaks Ct
- 2908 Post Oak Ct
- 2919 Tangle Oaks Ct
- 1612 Post Oak Dr
- 2908 Tangle Oaks Ct
- 2920 Spring Oaks Ct
- 2912 Post Oak Ct
- 2912 Tangle Oaks Ct
- 1700 Post Oak Dr