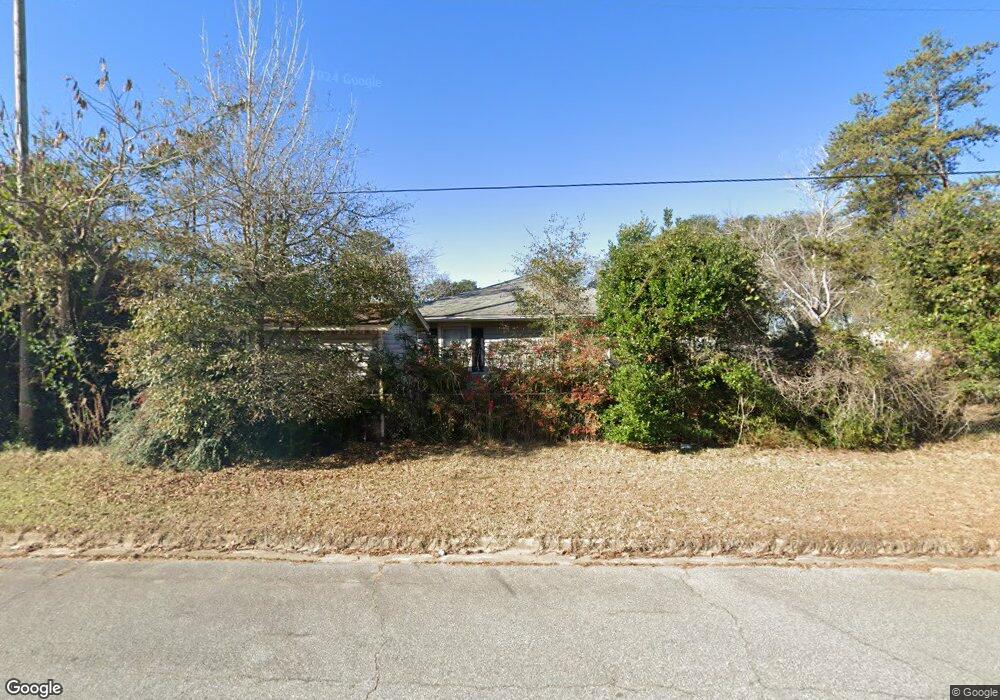
2908 Sylvester Hwy Albany, GA 31705
Estimated Value: $62,000 - $233,000
3
Beds
1
Bath
1,131
Sq Ft
$139/Sq Ft
Est. Value
About This Home
This home is located at 2908 Sylvester Hwy, Albany, GA 31705 and is currently estimated at $156,657, approximately $138 per square foot. 2908 Sylvester Hwy is a home located in Dougherty County with nearby schools including Turner Elementary School, Albany Middle School, and Radium Springs Middle School.
Ownership History
Date
Name
Owned For
Owner Type
Purchase Details
Closed on
Feb 1, 2022
Sold by
Miniz John H
Bought by
Juan Cynthia Francisco
Current Estimated Value
Home Financials for this Owner
Home Financials are based on the most recent Mortgage that was taken out on this home.
Original Mortgage
$165,000
Outstanding Balance
$141,748
Interest Rate
3.55%
Mortgage Type
Cash
Estimated Equity
$14,909
Purchase Details
Closed on
Nov 5, 2019
Sold by
Hernandez Francisca
Bought by
Miniz John H
Purchase Details
Closed on
Jun 10, 2019
Sold by
Minix John Thomas Holt
Bought by
Hernandez Francisca and Vazquez-Flores Francisco
Purchase Details
Closed on
Nov 13, 2012
Sold by
Minix Johnthomas Holt
Bought by
Minix Johnthomas Holt
Purchase Details
Closed on
Aug 15, 2008
Sold by
Minix E H
Bought by
Minix Kim Mark and Johnthomas Holt
Purchase Details
Closed on
Jul 13, 1950
Bought by
Minix E H
Create a Home Valuation Report for This Property
The Home Valuation Report is an in-depth analysis detailing your home's value as well as a comparison with similar homes in the area
Home Values in the Area
Average Home Value in this Area
Purchase History
| Date | Buyer | Sale Price | Title Company |
|---|---|---|---|
| Juan Cynthia Francisco | $175,000 | -- | |
| Miniz John H | -- | -- | |
| Hernandez Francisca | $260,000 | -- | |
| Minix Johnthomas Holt | -- | -- | |
| Minix Kim Mark | -- | -- | |
| Minix E H | -- | -- |
Source: Public Records
Mortgage History
| Date | Status | Borrower | Loan Amount |
|---|---|---|---|
| Open | Juan Cynthia Francisco | $165,000 |
Source: Public Records
Tax History Compared to Growth
Tax History
| Year | Tax Paid | Tax Assessment Tax Assessment Total Assessment is a certain percentage of the fair market value that is determined by local assessors to be the total taxable value of land and additions on the property. | Land | Improvement |
|---|---|---|---|---|
| 2024 | $1,322 | $27,720 | $8,800 | $18,920 |
| 2023 | $1,291 | $27,720 | $8,800 | $18,920 |
| 2022 | $1,296 | $27,720 | $8,800 | $18,920 |
| 2021 | $1,202 | $27,720 | $8,800 | $18,920 |
| 2020 | $1,205 | $27,720 | $8,800 | $18,920 |
| 2019 | $1,209 | $27,720 | $8,800 | $18,920 |
| 2018 | $1,214 | $27,720 | $8,800 | $18,920 |
| 2017 | $1,131 | $27,720 | $8,800 | $18,920 |
| 2016 | $1,132 | $27,720 | $8,800 | $18,920 |
| 2015 | $1,135 | $27,720 | $8,800 | $18,920 |
| 2014 | $1,129 | $27,920 | $9,000 | $18,920 |
Source: Public Records
Map
Nearby Homes
- 3007 E Park Ct
- 148 Force Dr
- 2731 Yorktown Ave
- 2725 Yorktown Ave
- 308 Forrestal Ln
- 2802 Banks Ave
- 2529 Cherokee Dr
- 2921 Madeline Rd
- 2523 Cherokee Dr
- 410 Johnson Rd
- 513 Johnson Rd
- 405 Pine Bluff Rd
- 234 Cone St
- 306 Elsom St
- 2215 E Broad Ave
- 307 Acorn St
- 309 Acorn St
- 2006 Keystone Ave
- 2004 Keystone Ave
- 119 N West Rd
- 2900 Powell Place
- 2808 Sylvester Hwy
- 2808 Sylvester Hwy
- 2916 Sylvester Hwy
- 2916 Sylvester Rd
- 2904 Powell Place
- 2903 Sylvester Rd
- 2901 Rosebrier Ave
- 2906 Powell Place
- 2901 Sylvester Rd
- 2918 Sylvester Hwy
- 2813 Sylvester Rd
- 2903 Rosebrier Ave
- 2905 Rosebrier Ave
- 2833 Sylvester Rd
- 106 Force Dr
- 2811 Sylvester Rd
- 2907 Rosebrier Ave
- 103 Pinson Rd
- 2902 Rosebrier Ave