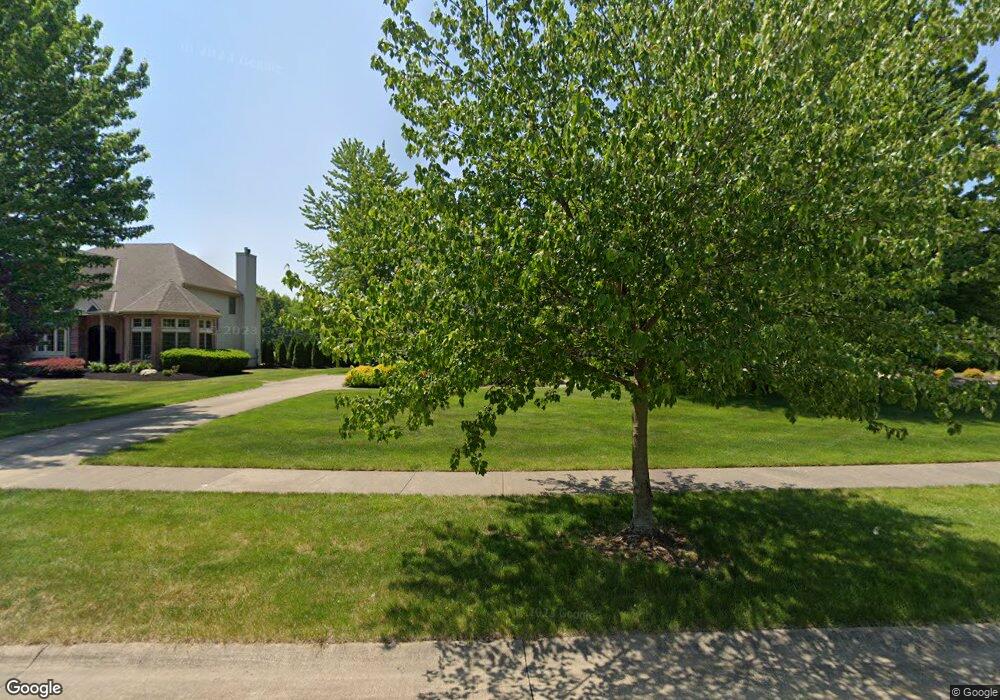
29089 Weybridge Dr Westlake, OH 44145
Estimated Value: $671,000 - $881,000
4
Beds
4
Baths
3,640
Sq Ft
$214/Sq Ft
Est. Value
About This Home
This home is located at 29089 Weybridge Dr, Westlake, OH 44145 and is currently estimated at $778,163, approximately $213 per square foot. 29089 Weybridge Dr is a home located in Cuyahoga County with nearby schools including Dover Intermediate School, Lee Burneson Middle School, and Westlake High School.
Ownership History
Date
Name
Owned For
Owner Type
Purchase Details
Closed on
Dec 19, 2016
Sold by
Feddrix Francis H and Feddrix Linda F
Bought by
Feddrix Francis H and Feddrix Linda F
Current Estimated Value
Purchase Details
Closed on
Mar 20, 1998
Sold by
Kanareff Homes Inc
Bought by
Feddrix Francis H and Feddrix Linda F
Home Financials for this Owner
Home Financials are based on the most recent Mortgage that was taken out on this home.
Original Mortgage
$160,000
Outstanding Balance
$29,607
Interest Rate
7.15%
Estimated Equity
$748,556
Purchase Details
Closed on
May 30, 1996
Sold by
Kopf/Kleist Dev Ltd Ptns
Bought by
Kanareff Homes Inc
Home Financials for this Owner
Home Financials are based on the most recent Mortgage that was taken out on this home.
Original Mortgage
$420,000
Interest Rate
7.99%
Mortgage Type
New Conventional
Create a Home Valuation Report for This Property
The Home Valuation Report is an in-depth analysis detailing your home's value as well as a comparison with similar homes in the area
Home Values in the Area
Average Home Value in this Area
Purchase History
| Date | Buyer | Sale Price | Title Company |
|---|---|---|---|
| Feddrix Francis H | -- | None Available | |
| Feddrix Francis H | $406,000 | Midland Title Security Inc | |
| Kanareff Homes Inc | $640,000 | -- |
Source: Public Records
Mortgage History
| Date | Status | Borrower | Loan Amount |
|---|---|---|---|
| Open | Feddrix Francis H | $160,000 | |
| Previous Owner | Kanareff Homes Inc | $420,000 |
Source: Public Records
Tax History Compared to Growth
Tax History
| Year | Tax Paid | Tax Assessment Tax Assessment Total Assessment is a certain percentage of the fair market value that is determined by local assessors to be the total taxable value of land and additions on the property. | Land | Improvement |
|---|---|---|---|---|
| 2024 | $11,210 | $236,635 | $54,355 | $182,280 |
| 2023 | $10,781 | $194,570 | $46,590 | $147,980 |
| 2022 | $10,609 | $194,570 | $46,590 | $147,980 |
| 2021 | $10,622 | $194,570 | $46,590 | $147,980 |
| 2020 | $11,353 | $190,750 | $45,680 | $145,080 |
| 2019 | $11,008 | $545,000 | $130,500 | $414,500 |
| 2018 | $5,529 | $190,750 | $45,680 | $145,080 |
| 2017 | $10,397 | $168,710 | $44,140 | $124,570 |
| 2016 | $10,341 | $168,710 | $44,140 | $124,570 |
| 2015 | $10,286 | $168,710 | $44,140 | $124,570 |
| 2014 | $9,407 | $150,640 | $39,410 | $111,230 |
Source: Public Records
Map
Nearby Homes
- 29579 Devonshire Oval
- 28360 Center Ridge Rd Unit 226
- 28340 Center Ridge Rd Unit 123
- 3450 Briar Ridge Ct Unit F
- 28080 Center Ridge Rd
- 3115 Bay Landing Dr Unit 3115
- 3152 Bay Landing Dr
- 2995 N Bay Dr Unit I14
- 29772 Hilliard Oak Ln
- 28152 Sherwood Dr
- 2820 N Bay Dr
- 3283 Bay Landing Dr Unit 3283
- 3263 Bay Landing Dr Unit 27
- 29458 Hummingbird Cir Unit 71
- 3769 Trenton Ct Unit 39
- 28744 Woodmill Dr
- 27387 Westown Blvd Unit 1404
- 3222 Balsam Dr
- 29647 Indian Ridge Cove
- 27413 Westown Blvd Unit 1605
- 29157 Weybridge Dr
- 29055 Weybridge Dr
- 29191 Weybridge Dr
- 29021 Weybridge Dr
- 29084 Weybridge Dr
- 29118 Weybridge Dr
- 29152 Weybridge Dr
- 29050 Weybridge Dr
- 28987 Weybridge Dr
- 29225 Weybridge Dr
- 29186 Weybridge Dr
- 29016 Weybridge Dr
- 3110 Chatham Ct
- 3039 Regency Place
- 3110 Chatham Ct
- 28982 Weybridge Dr
- 28953 Weybridge Dr
- 29232 Regency Cir
- 3134 Chatham Ct
- 29228 Regency Cir