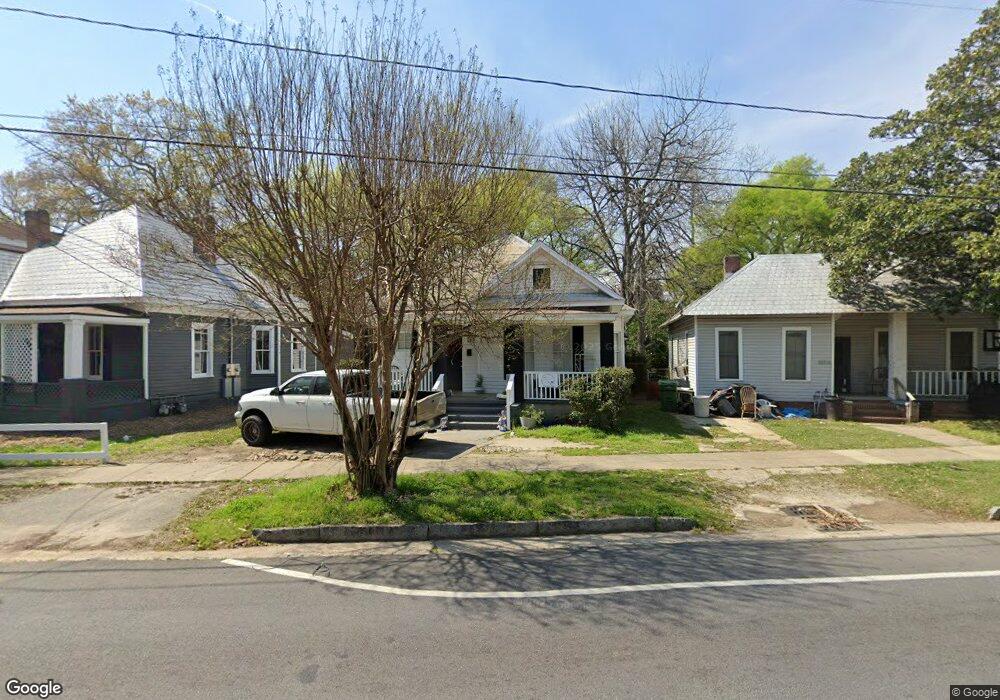
2909 12th Ave Columbus, GA 31904
Waverly Terrace NeighborhoodEstimated Value: $114,000 - $139,543
3
Beds
3
Baths
1,594
Sq Ft
$81/Sq Ft
Est. Value
About This Home
This home is located at 2909 12th Ave, Columbus, GA 31904 and is currently estimated at $129,848, approximately $81 per square foot. 2909 12th Ave is a home located in Muscogee County with nearby schools including Hannan Elementary School, Arnold Middle School, and Jordan Vocational High School.
Ownership History
Date
Name
Owned For
Owner Type
Purchase Details
Closed on
Mar 16, 2016
Sold by
Sec Of Housing & U
Bought by
Cf Properties Llc
Current Estimated Value
Purchase Details
Closed on
Aug 4, 2015
Sold by
Wells Fargo Bank
Bought by
Sec Of Housing & Urban
Purchase Details
Closed on
May 25, 2011
Sold by
Batts Richard K
Bought by
Holland Dee Dee
Home Financials for this Owner
Home Financials are based on the most recent Mortgage that was taken out on this home.
Original Mortgage
$68,127
Interest Rate
4.75%
Mortgage Type
FHA
Purchase Details
Closed on
Aug 20, 2010
Sold by
Batts Rick
Bought by
Batts Ii Richard K
Purchase Details
Closed on
Aug 19, 2010
Sold by
Federal Home Loan Mortgage Corporation
Bought by
Batts Rick
Purchase Details
Closed on
Mar 2, 2010
Sold by
Chase Home Finance Llc
Bought by
Federal Home Loan Mortgage Corp
Create a Home Valuation Report for This Property
The Home Valuation Report is an in-depth analysis detailing your home's value as well as a comparison with similar homes in the area
Home Values in the Area
Average Home Value in this Area
Purchase History
| Date | Buyer | Sale Price | Title Company |
|---|---|---|---|
| Cf Properties Llc | $26,100 | -- | |
| Sec Of Housing & Urban | $39,900 | -- | |
| Wells Fargo Bank | -- | -- | |
| Holland Dee Dee | $69,900 | -- | |
| Batts Ii Richard K | -- | None Available | |
| Batts Rick | -- | None Available | |
| Federal Home Loan Mortgage Corp | -- | None Available | |
| Chase Home Finance Llc | $37,996 | None Available |
Source: Public Records
Mortgage History
| Date | Status | Borrower | Loan Amount |
|---|---|---|---|
| Previous Owner | Holland Dee Dee | $68,127 |
Source: Public Records
Tax History Compared to Growth
Tax History
| Year | Tax Paid | Tax Assessment Tax Assessment Total Assessment is a certain percentage of the fair market value that is determined by local assessors to be the total taxable value of land and additions on the property. | Land | Improvement |
|---|---|---|---|---|
| 2025 | $1,832 | $46,800 | $9,608 | $37,192 |
| 2024 | $1,228 | $50,764 | $9,608 | $41,156 |
| 2023 | $1,236 | $31,380 | $8,304 | $23,076 |
| 2022 | $1,281 | $31,380 | $8,304 | $23,076 |
| 2021 | $1,089 | $31,380 | $8,304 | $23,076 |
| 2020 | $1,483 | $25,096 | $9,608 | $15,488 |
| 2019 | $1,394 | $40,020 | $9,608 | $30,412 |
| 2018 | $1,640 | $40,020 | $9,608 | $30,412 |
| 2017 | $429 | $10,440 | $3,160 | $7,280 |
| 2016 | $1,320 | $32,000 | $2,470 | $29,530 |
| 2015 | $1,322 | $32,000 | $2,470 | $29,530 |
| 2014 | $609 | $32,000 | $2,470 | $29,530 |
| 2013 | -- | $32,000 | $2,470 | $29,530 |
Source: Public Records
Map
Nearby Homes
- 2905 12th Ave
- 2905 12th Ave Unit B
- 2905 12th Ave Unit A
- 2913 12th Ave
- 2917 12th Ave
- 2901 12th Ave
- 2921 12th Ave
- 2906 Peabody Ave
- 2904 Peabody Ave
- 2908 Peabody Ave
- 2923 12th Ave
- 2910 Peabody Ave
- 2900 Peabody Ave
- 2912 12th Ave
- 2908 12th Ave
- 2912 Peabody Ave
- 2916 12th Ave
- 2827 Waverly Ave
- 2827 Waverly Ave Unit B
- 2827 Waverly Ave Unit A