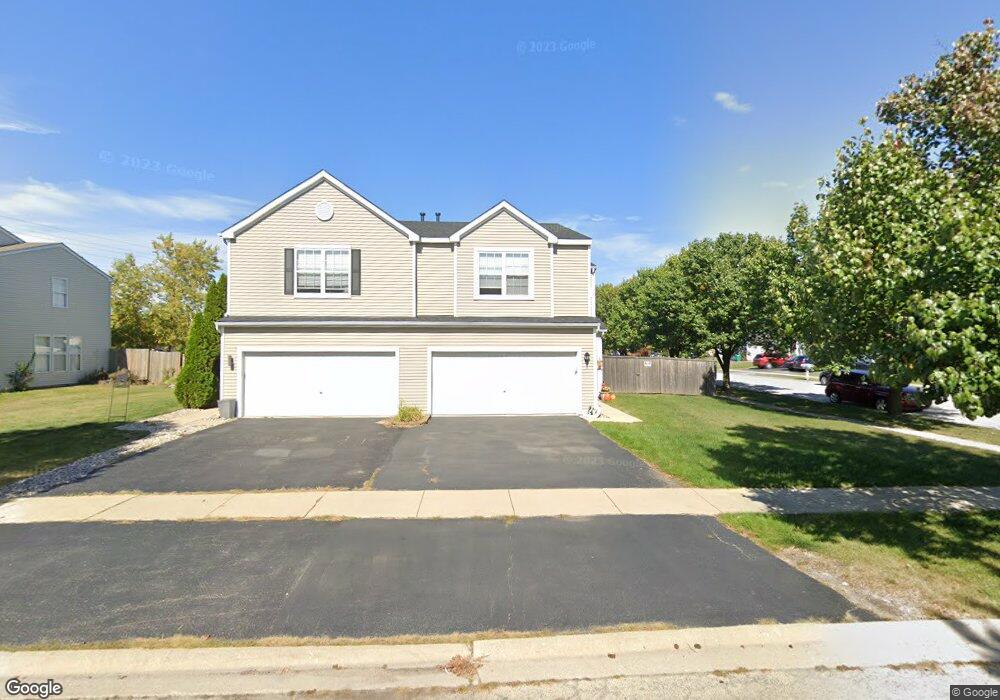
2909 Boone Ct Joliet, IL 60435
Crystal Lawns NeighborhoodEstimated Value: $287,372 - $321,000
2
Beds
2
Baths
1,560
Sq Ft
$192/Sq Ft
Est. Value
About This Home
This home is located at 2909 Boone Ct, Joliet, IL 60435 and is currently estimated at $299,343, approximately $191 per square foot. 2909 Boone Ct is a home located in Will County with nearby schools including Central Elementary School, Indian Trail Middle School, and Plainfield Central High School.
Ownership History
Date
Name
Owned For
Owner Type
Purchase Details
Closed on
Mar 20, 2013
Sold by
Czopkiewicz Casey H
Bought by
Czopkiewicz Casey H and Czopkiewicz Patricia F
Current Estimated Value
Purchase Details
Closed on
Jan 2, 2012
Sold by
Czopkiewiz Patriia F
Bought by
Czopkiewicz Casey H
Purchase Details
Closed on
Oct 3, 2006
Sold by
Lickwar Nelson A
Bought by
Czopkiewicz Casey M and Czopkiewicz Patricia F
Home Financials for this Owner
Home Financials are based on the most recent Mortgage that was taken out on this home.
Original Mortgage
$169,575
Interest Rate
6.49%
Mortgage Type
Balloon
Purchase Details
Closed on
Mar 3, 2003
Sold by
Centex Homes
Bought by
Lickwar Nelson A
Home Financials for this Owner
Home Financials are based on the most recent Mortgage that was taken out on this home.
Original Mortgage
$153,486
Interest Rate
5.51%
Mortgage Type
VA
Create a Home Valuation Report for This Property
The Home Valuation Report is an in-depth analysis detailing your home's value as well as a comparison with similar homes in the area
Home Values in the Area
Average Home Value in this Area
Purchase History
| Date | Buyer | Sale Price | Title Company |
|---|---|---|---|
| Czopkiewicz Casey H | -- | None Available | |
| Czopkiewicz Casey H | -- | None Available | |
| Czopkiewicz Casey M | $178,500 | Attorneys Title Guaranty Fun | |
| Lickwar Nelson A | $150,500 | Chicago Title Insurance Co |
Source: Public Records
Mortgage History
| Date | Status | Borrower | Loan Amount |
|---|---|---|---|
| Closed | Czopkiewicz Casey M | $169,575 | |
| Previous Owner | Lickwar Nelson A | $153,486 |
Source: Public Records
Tax History Compared to Growth
Tax History
| Year | Tax Paid | Tax Assessment Tax Assessment Total Assessment is a certain percentage of the fair market value that is determined by local assessors to be the total taxable value of land and additions on the property. | Land | Improvement |
|---|---|---|---|---|
| 2024 | $4,666 | $81,149 | $13,064 | $68,085 |
| 2023 | $4,666 | $73,292 | $11,799 | $61,493 |
| 2022 | $4,305 | $65,826 | $10,597 | $55,229 |
| 2021 | $3,767 | $61,520 | $9,904 | $51,616 |
| 2020 | $4,091 | $59,775 | $9,623 | $50,152 |
| 2019 | $4,211 | $56,956 | $9,169 | $47,787 |
| 2018 | $4,020 | $53,513 | $8,615 | $44,898 |
| 2017 | $3,891 | $50,854 | $8,187 | $42,667 |
| 2016 | $3,803 | $48,501 | $7,808 | $40,693 |
| 2015 | $4,134 | $45,434 | $7,314 | $38,120 |
| 2014 | $4,134 | $43,830 | $7,056 | $36,774 |
| 2013 | $4,134 | $50,320 | $7,056 | $43,264 |
Source: Public Records
Map
Nearby Homes
- Lot #3 S End Rd
- 3114 Hillary Ct
- 12 Dan Ireland Dr Unit 13
- 3511 Sumac Dr
- 3714 Harms Rd
- 21543 Eich Dr
- 21533 Cormorant St
- 21546 Victory Lake Way Unit 8
- 21522 Lake st Clair Dr
- 21531 Wolf Lake Way
- 16400 Crescent Lake Dr
- 16416 Crescent Lake Ct
- 16453 Timberview Dr
- 16012 Carillon Lakes Ct
- 3032 Woodside Dr Unit 65
- 2408 Chestnut St
- 21316 Brush Lake Dr
- 21308 Brush Lake Dr
- 4022 Hennepin Dr Unit 171
- 2929 Woodside Dr Unit 26
- 2913 Boone Ct Unit 1
- 3611 Indian Head Ln
- 2915 Boone Ct
- 2915 Boone Ct Unit 2815
- 3606 Indian Head Ln
- 3606 Indian Head Ln Unit 3606
- 3604 Indian Head Ln
- 3608 Indian Head Ln
- 3613 Indian Head Ln
- 2917 Boone Ct
- 3610 Indian Head Ln Unit 1
- 2912 Boone Ct Unit 1
- 3615 Indian Head Ln
- 2914 Boone Ct
- 3612 Indian Head Ln
- 2906 Stonewall Ln
- 2916 Boone Ct
- 2919 Boone Ct
- 3617 Indian Head Ln Unit 1
- 3614 Indian Head Ln Unit 1