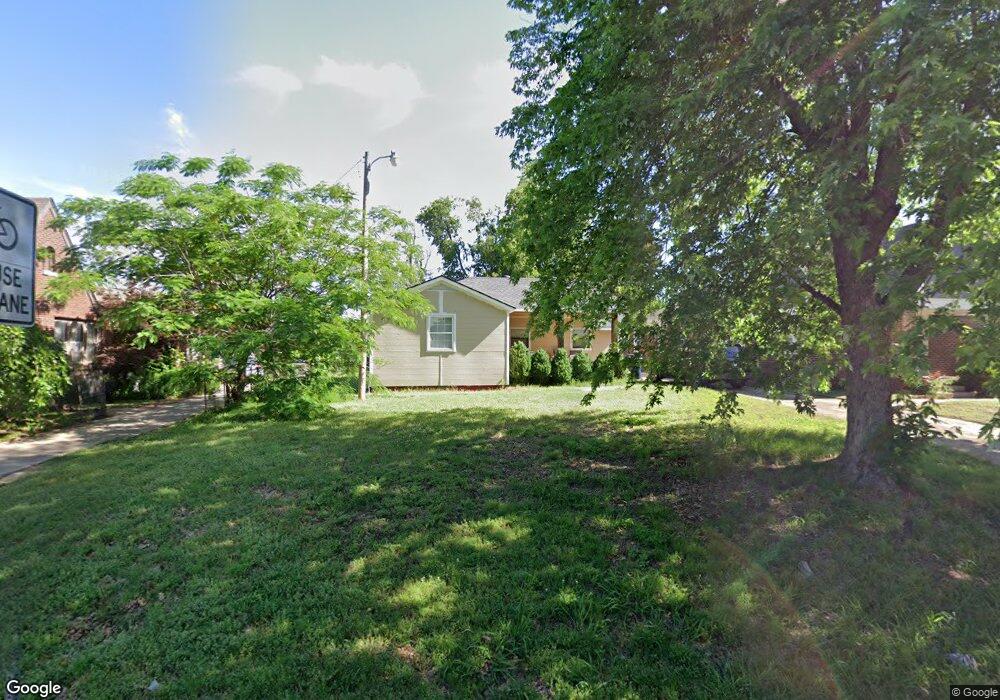
2909 NW 19th St Oklahoma City, OK 73107
Milam Place NeighborhoodEstimated Value: $155,000 - $171,000
3
Beds
1
Bath
1,128
Sq Ft
$145/Sq Ft
Est. Value
About This Home
This home is located at 2909 NW 19th St, Oklahoma City, OK 73107 and is currently estimated at $163,606, approximately $145 per square foot. 2909 NW 19th St is a home located in Oklahoma County with nearby schools including Kaiser Elementary School, Taft Middle School, and Northwest Classen High School.
Ownership History
Date
Name
Owned For
Owner Type
Purchase Details
Closed on
May 18, 2009
Sold by
Wilson William W and Wilson Jamie
Bought by
Warme Isaac D
Current Estimated Value
Home Financials for this Owner
Home Financials are based on the most recent Mortgage that was taken out on this home.
Original Mortgage
$69,714
Outstanding Balance
$43,833
Interest Rate
4.76%
Mortgage Type
FHA
Estimated Equity
$119,773
Purchase Details
Closed on
Dec 3, 2003
Sold by
Mosley Brent W and Mosley Rebecca D
Bought by
Wilson William W and Wilson Jamie
Purchase Details
Closed on
Feb 8, 2000
Sold by
Strolle Paul F and Strolle Debbie
Bought by
Mosley Brent W and Mosley Rebecca D
Home Financials for this Owner
Home Financials are based on the most recent Mortgage that was taken out on this home.
Original Mortgage
$40,640
Interest Rate
8.09%
Mortgage Type
FHA
Create a Home Valuation Report for This Property
The Home Valuation Report is an in-depth analysis detailing your home's value as well as a comparison with similar homes in the area
Home Values in the Area
Average Home Value in this Area
Purchase History
| Date | Buyer | Sale Price | Title Company |
|---|---|---|---|
| Warme Isaac D | $71,000 | Capitol Abstract & Title | |
| Wilson William W | $50,500 | Capitol Abstract & Title | |
| Mosley Brent W | $40,500 | -- |
Source: Public Records
Mortgage History
| Date | Status | Borrower | Loan Amount |
|---|---|---|---|
| Open | Warme Isaac D | $69,714 | |
| Previous Owner | Mosley Brent W | $40,640 |
Source: Public Records
Tax History Compared to Growth
Tax History
| Year | Tax Paid | Tax Assessment Tax Assessment Total Assessment is a certain percentage of the fair market value that is determined by local assessors to be the total taxable value of land and additions on the property. | Land | Improvement |
|---|---|---|---|---|
| 2024 | $1,271 | $10,868 | $1,863 | $9,005 |
| 2023 | $1,271 | $10,350 | $2,123 | $8,227 |
| 2022 | $1,160 | $9,858 | $2,131 | $7,727 |
| 2021 | $1,105 | $9,389 | $2,435 | $6,954 |
| 2020 | $1,065 | $8,942 | $1,630 | $7,312 |
| 2019 | $1,013 | $8,516 | $1,679 | $6,837 |
| 2018 | $920 | $8,111 | $0 | $0 |
| 2017 | $875 | $7,723 | $1,669 | $6,054 |
| 2016 | $834 | $7,356 | $1,648 | $5,708 |
| 2015 | $802 | $7,006 | $1,676 | $5,330 |
| 2014 | $788 | $6,919 | $1,676 | $5,243 |
Source: Public Records
Map
Nearby Homes
- 2822 NW 19th St
- 2854 NW 19th St
- 2841 NW 20th St
- 2208 N Brookline Ave
- 2939 NW 15th St
- 2765 NW 20th St
- 2809 NW 21st St
- 2934 NW 15th St
- 3104 NW 21st St
- 2938 NW 14th St
- 1521 N Drexel Blvd
- 2748 NW 22nd St
- 3105 NW 22nd St
- 1605 N Miller Blvd
- 3132 NW 16th St
- 2749 NW 22nd St
- 3216 NW 19th St
- 1513 N Miller Blvd
- 3013 NW 24th St
- 3117 NW 23rd St
- 2907 NW 19th St
- 2905 NW 19th St
- 2915 NW 19th St
- 2908 NW 20th St
- 2910 NW 20th St
- 2912 NW 20th St
- 2904 NW 20th St
- 2917 NW 19th St
- 2901 NW 19th St
- 2914 NW 20th St
- 2900 NW 20th St
- 2923 NW 19th St
- 2918 NW 20th St
- 2927 NW 19th St
- 2922 NW 20th St
- 2861 NW 19th St
- 2912 NW 19th St
- 2908 NW 19th St
- 2900 NW 19th St
- 2916 NW 19th St