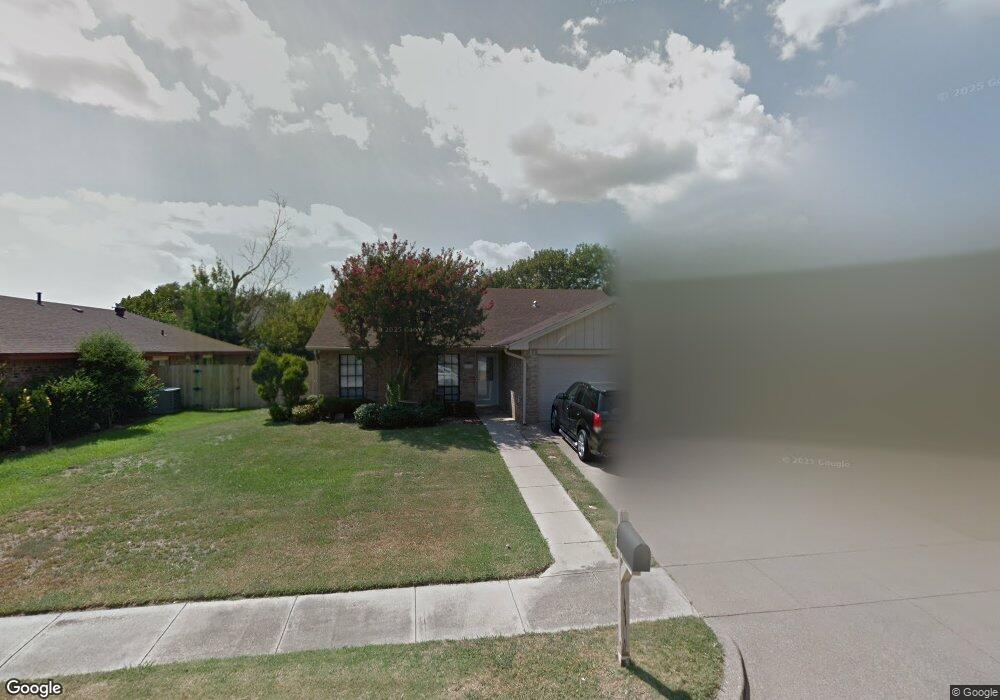
2909 Turtlerock Dr Bedford, TX 76021
Estimated Value: $338,878 - $376,000
3
Beds
2
Baths
1,920
Sq Ft
$188/Sq Ft
Est. Value
About This Home
This home is located at 2909 Turtlerock Dr, Bedford, TX 76021 and is currently estimated at $360,220, approximately $187 per square foot. 2909 Turtlerock Dr is a home located in Tarrant County with nearby schools including Spring Garden Elementary School, Harwood Junior High School, and Trinity High School.
Ownership History
Date
Name
Owned For
Owner Type
Purchase Details
Closed on
Sep 15, 2005
Sold by
Cors Gregory Brian and Cors Ann Marie
Bought by
Ramirez Raul and Ramirez Maria L
Current Estimated Value
Home Financials for this Owner
Home Financials are based on the most recent Mortgage that was taken out on this home.
Original Mortgage
$107,920
Outstanding Balance
$63,399
Interest Rate
7.45%
Mortgage Type
Fannie Mae Freddie Mac
Estimated Equity
$296,821
Purchase Details
Closed on
Dec 15, 1998
Sold by
Chiofalo Peter D and Chiofalo Gail R
Bought by
Cors Gregory Brian and Cors Ann Marie
Home Financials for this Owner
Home Financials are based on the most recent Mortgage that was taken out on this home.
Original Mortgage
$92,497
Interest Rate
6.87%
Mortgage Type
FHA
Create a Home Valuation Report for This Property
The Home Valuation Report is an in-depth analysis detailing your home's value as well as a comparison with similar homes in the area
Home Values in the Area
Average Home Value in this Area
Purchase History
| Date | Buyer | Sale Price | Title Company |
|---|---|---|---|
| Ramirez Raul | -- | Alamo Title Company | |
| Cors Gregory Brian | -- | Ticor Land Title |
Source: Public Records
Mortgage History
| Date | Status | Borrower | Loan Amount |
|---|---|---|---|
| Open | Ramirez Raul | $107,920 | |
| Previous Owner | Cors Gregory Brian | $92,497 |
Source: Public Records
Tax History Compared to Growth
Tax History
| Year | Tax Paid | Tax Assessment Tax Assessment Total Assessment is a certain percentage of the fair market value that is determined by local assessors to be the total taxable value of land and additions on the property. | Land | Improvement |
|---|---|---|---|---|
| 2025 | $3,913 | $289,000 | $75,000 | $214,000 |
| 2024 | $3,913 | $305,662 | $75,000 | $230,662 |
| 2023 | $4,987 | $297,102 | $45,000 | $252,102 |
| 2022 | $5,163 | $247,996 | $45,000 | $202,996 |
| 2021 | $5,062 | $222,272 | $45,000 | $177,272 |
| 2020 | $4,645 | $205,741 | $45,000 | $160,741 |
| 2019 | $4,314 | $207,080 | $45,000 | $162,080 |
| 2018 | $3,540 | $161,450 | $45,000 | $116,450 |
| 2017 | $3,551 | $171,488 | $18,000 | $153,488 |
| 2016 | $3,228 | $163,482 | $18,000 | $145,482 |
| 2015 | $2,771 | $121,300 | $18,000 | $103,300 |
| 2014 | $2,771 | $121,300 | $18,000 | $103,300 |
Source: Public Records
Map
Nearby Homes
- 2922 Beachtree Ln
- 2600 Willow Bend
- 2909 Oakridge Dr
- 3024 Highgate Ln
- 2616 Greenwood Ct
- 2521 Sanders Ct
- 2220 Tiffany Glenn Ct
- 2709 Willow Bend
- 3152 Woodbridge Dr
- 2516 Classic Ct W
- 2601 Murphy Dr
- 2609 Woodson Dr
- 2700 Mimosa Ct
- 2501 Murphy Dr
- 2417 Meadow Ct
- 3017 Bluebonnet Ln
- 3532 Meadowside Dr
- 3001 Glenwood Ct
- 2109 Oakmeadow St
- 3513 Meadowside Dr
- 2913 Turtlerock Dr
- 2905 Turtlerock Dr
- 2904 Woodbridge Dr
- 2917 Turtlerock Dr
- 2908 Woodbridge Dr
- 2900 Woodbridge Dr
- 2912 Woodbridge Dr
- 2908 Turtlerock Dr
- 2912 Turtlerock Dr
- 2904 Turtlerock Dr
- 2921 Turtlerock Dr
- 2916 Turtlerock Dr
- 2916 Woodbridge Dr
- 2420 Beachtree Ln
- 2416 Beachtree Ln
- 2920 Turtlerock Dr
- 2900 Beachtree Ln
- 2412 Beachtree Ln
- 2920 Woodbridge Dr
- 2921 Beachtree Ln