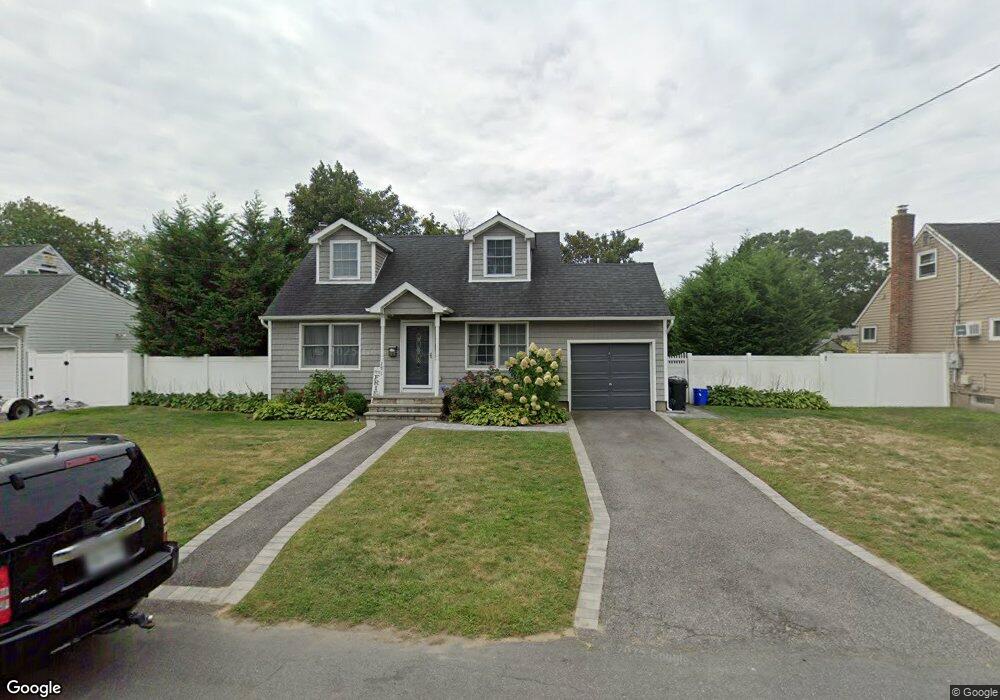
291 28th St Lindenhurst, NY 11757
Estimated Value: $614,554 - $733,000
4
Beds
2
Baths
1,291
Sq Ft
$508/Sq Ft
Est. Value
About This Home
This home is located at 291 28th St, Lindenhurst, NY 11757 and is currently estimated at $655,639, approximately $507 per square foot. 291 28th St is a home located in Suffolk County with nearby schools including Albany Avenue Elementary School, Lindenhurst Middle School, and Lindenhurst Senior High School.
Ownership History
Date
Name
Owned For
Owner Type
Purchase Details
Closed on
Apr 16, 2020
Sold by
Tringali Katelyn
Bought by
Zaldivar Rafael A and Zaldivar Renee
Current Estimated Value
Home Financials for this Owner
Home Financials are based on the most recent Mortgage that was taken out on this home.
Original Mortgage
$454,100
Outstanding Balance
$403,783
Interest Rate
3.6%
Mortgage Type
New Conventional
Estimated Equity
$251,856
Purchase Details
Closed on
May 4, 2018
Sold by
Gnatowski Greg
Bought by
Tringali Katelyn
Home Financials for this Owner
Home Financials are based on the most recent Mortgage that was taken out on this home.
Original Mortgage
$391,400
Interest Rate
4.4%
Mortgage Type
New Conventional
Purchase Details
Closed on
Nov 17, 2017
Sold by
Fitzpatrick Brian and Ketcham Kathleen
Bought by
Luca Michael
Purchase Details
Closed on
Jun 25, 2004
Sold by
Fitzpatrick James J and Fitzpatrick Blanche
Bought by
Fitzpatrick Blanche
Create a Home Valuation Report for This Property
The Home Valuation Report is an in-depth analysis detailing your home's value as well as a comparison with similar homes in the area
Home Values in the Area
Average Home Value in this Area
Purchase History
| Date | Buyer | Sale Price | Title Company |
|---|---|---|---|
| Zaldivar Rafael A | $478,000 | None Available | |
| Tringali Katelyn | $412,000 | -- | |
| Luca Michael | $180,000 | -- | |
| Fitzpatrick Blanche | -- | Columbia |
Source: Public Records
Mortgage History
| Date | Status | Borrower | Loan Amount |
|---|---|---|---|
| Open | Zaldivar Rafael A | $454,100 | |
| Previous Owner | Tringali Katelyn | $391,400 |
Source: Public Records
Tax History
| Year | Tax Paid | Tax Assessment Tax Assessment Total Assessment is a certain percentage of the fair market value that is determined by local assessors to be the total taxable value of land and additions on the property. | Land | Improvement |
|---|---|---|---|---|
| 2024 | $9,739 | $2,510 | $280 | $2,230 |
| 2023 | $8,466 | $2,510 | $280 | $2,230 |
| 2022 | $6,882 | $2,510 | $280 | $2,230 |
| 2021 | $6,882 | $2,510 | $280 | $2,230 |
| 2020 | $7,849 | $2,510 | $280 | $2,230 |
| 2019 | $8,715 | $0 | $0 | $0 |
| 2018 | $4,031 | $2,510 | $280 | $2,230 |
| 2017 | $4,031 | $2,510 | $280 | $2,230 |
| 2016 | $4,078 | $2,510 | $280 | $2,230 |
| 2015 | -- | $2,510 | $280 | $2,230 |
| 2014 | -- | $2,510 | $280 | $2,230 |
Source: Public Records
Map
Nearby Homes
Your Personal Tour Guide
Ask me questions while you tour the home.