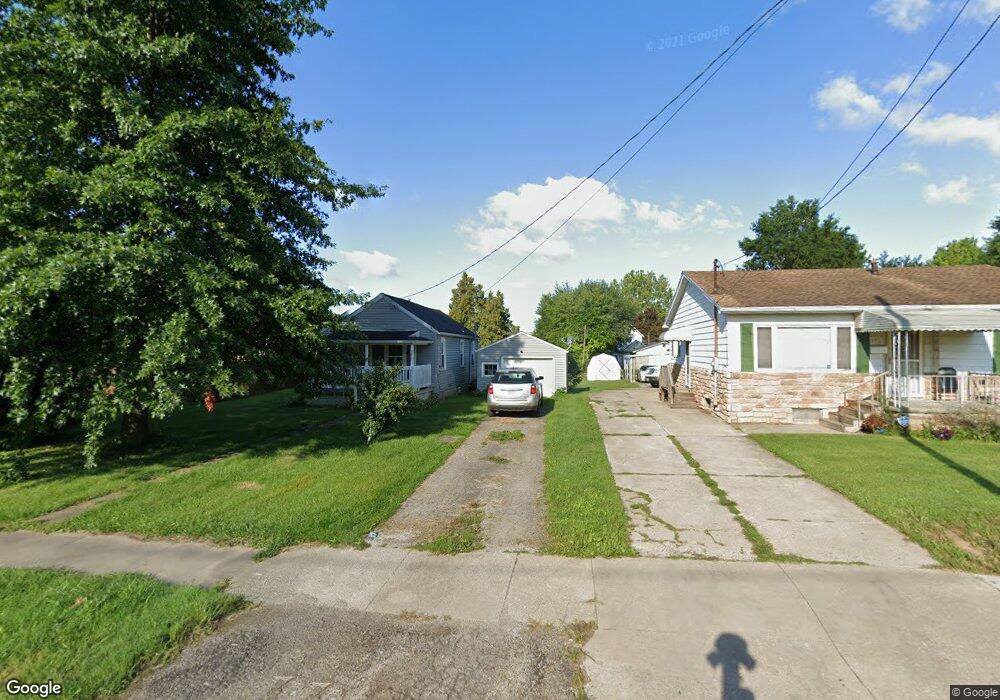
291 5th Ave Mansfield, OH 44905
Estimated Value: $56,000 - $97,000
2
Beds
1
Bath
596
Sq Ft
$121/Sq Ft
Est. Value
About This Home
This home is located at 291 5th Ave, Mansfield, OH 44905 and is currently estimated at $72,236, approximately $121 per square foot. 291 5th Ave is a home located in Richland County with nearby schools including St. Peter's Elementary/Montessori School, Temple-Christian School, and St. Peter's Junior High / High School.
Ownership History
Date
Name
Owned For
Owner Type
Purchase Details
Closed on
Mar 22, 2021
Sold by
Wagoner Michael F and Wagoner Michael
Bought by
Craig Andre and Craig Denice
Current Estimated Value
Purchase Details
Closed on
Jun 12, 2000
Sold by
Davis Duane E
Bought by
Wagoner Barbara J
Home Financials for this Owner
Home Financials are based on the most recent Mortgage that was taken out on this home.
Original Mortgage
$20,150
Interest Rate
8.14%
Mortgage Type
New Conventional
Create a Home Valuation Report for This Property
The Home Valuation Report is an in-depth analysis detailing your home's value as well as a comparison with similar homes in the area
Home Values in the Area
Average Home Value in this Area
Purchase History
| Date | Buyer | Sale Price | Title Company |
|---|---|---|---|
| Craig Andre | $1,000 | None Available | |
| Wagoner Barbara J | $19,200 | -- |
Source: Public Records
Mortgage History
| Date | Status | Borrower | Loan Amount |
|---|---|---|---|
| Previous Owner | Wagoner Barbara J | $20,150 |
Source: Public Records
Tax History
| Year | Tax Paid | Tax Assessment Tax Assessment Total Assessment is a certain percentage of the fair market value that is determined by local assessors to be the total taxable value of land and additions on the property. | Land | Improvement |
|---|---|---|---|---|
| 2024 | $366 | $7,650 | $1,700 | $5,950 |
| 2023 | $366 | $7,650 | $1,700 | $5,950 |
| 2022 | $385 | $6,740 | $1,720 | $5,020 |
| 2021 | $379 | $6,740 | $1,720 | $5,020 |
| 2020 | $388 | $6,740 | $1,720 | $5,020 |
| 2019 | $430 | $6,740 | $1,720 | $5,020 |
| 2018 | $424 | $6,740 | $1,720 | $5,020 |
| 2017 | $412 | $6,740 | $1,720 | $5,020 |
| 2016 | $452 | $7,170 | $2,290 | $4,880 |
| 2015 | $432 | $7,170 | $2,290 | $4,880 |
| 2014 | $427 | $7,170 | $2,290 | $4,880 |
| 2012 | $405 | $7,390 | $2,360 | $5,030 |
Source: Public Records
Map
Nearby Homes
- 382 Orange St
- 387 Auburn St
- 411 Grace St
- 0 North St Unit 9072753
- 90 Oak St
- 62 Bahl Ave
- 822 Park Ave E
- 832 Park Ave E
- 146 E 1st St
- 0 Lot #23128 Unit 9069815
- 195 Hedges St
- 291 Stewart Rd N
- 167 S Adams St
- 203 Home Ave
- 223 Hedges St
- 410 Birdcage Walk
- 260 Dale Ave
- 580 N Mulberry St
- 118 Raymond Ave
- 524 Lida St
Your Personal Tour Guide
Ask me questions while you tour the home.