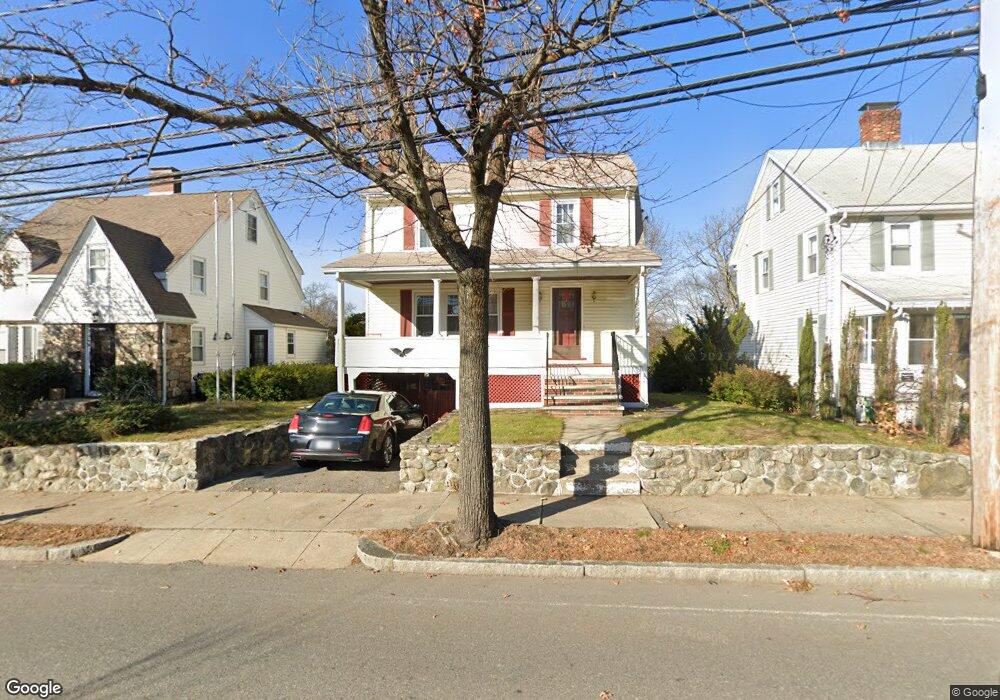
291 Appleton St Arlington, MA 02476
Arlington Heights NeighborhoodEstimated Value: $869,023 - $987,000
3
Beds
2
Baths
1,430
Sq Ft
$653/Sq Ft
Est. Value
About This Home
This home is located at 291 Appleton St, Arlington, MA 02476 and is currently estimated at $934,006, approximately $653 per square foot. 291 Appleton St is a home located in Middlesex County with nearby schools including Dallin Elementary School, Ottoson Middle School, and Arlington High School.
Ownership History
Date
Name
Owned For
Owner Type
Purchase Details
Closed on
Mar 27, 1995
Sold by
Soares Maria D
Bought by
Proctor Carl I and Palmariello Theresa
Current Estimated Value
Home Financials for this Owner
Home Financials are based on the most recent Mortgage that was taken out on this home.
Original Mortgage
$160,000
Interest Rate
8.78%
Mortgage Type
Purchase Money Mortgage
Create a Home Valuation Report for This Property
The Home Valuation Report is an in-depth analysis detailing your home's value as well as a comparison with similar homes in the area
Home Values in the Area
Average Home Value in this Area
Purchase History
| Date | Buyer | Sale Price | Title Company |
|---|---|---|---|
| Proctor Carl I | $200,000 | -- | |
| Proctor Carl I | $200,000 | -- |
Source: Public Records
Mortgage History
| Date | Status | Borrower | Loan Amount |
|---|---|---|---|
| Open | Proctor Carl I | $160,000 | |
| Closed | Proctor Carl I | $160,000 | |
| Previous Owner | Proctor Carl I | $60,000 |
Source: Public Records
Tax History
| Year | Tax Paid | Tax Assessment Tax Assessment Total Assessment is a certain percentage of the fair market value that is determined by local assessors to be the total taxable value of land and additions on the property. | Land | Improvement |
|---|---|---|---|---|
| 2025 | $7,710 | $715,900 | $432,300 | $283,600 |
| 2024 | $7,398 | $698,600 | $432,300 | $266,300 |
| 2023 | $7,045 | $628,500 | $384,900 | $243,600 |
| 2022 | $6,748 | $590,900 | $369,100 | $221,800 |
| 2021 | $6,627 | $584,400 | $369,100 | $215,300 |
| 2020 | $6,639 | $600,300 | $369,100 | $231,200 |
| 2019 | $6,263 | $556,200 | $369,100 | $187,100 |
| 2018 | $6,121 | $504,600 | $311,100 | $193,500 |
| 2017 | $6,403 | $509,800 | $299,700 | $210,100 |
| 2016 | $5,957 | $465,400 | $255,300 | $210,100 |
| 2015 | $5,700 | $420,700 | $222,000 | $198,700 |
Source: Public Records
Map
Nearby Homes
- 74 Wollaston Ave
- 211 Florence Ave
- 64 Browning Rd
- 122 Sylvia St
- 36 Dundee Rd
- 4 Aerial St
- 34 Bow St
- 7 Park Avenue Extension
- 12 Brandon St
- 33 Harvard St
- 120 Crestview Rd
- 97 Bow St
- 181 Lowell St
- 17 Oakledge St
- 11 Lowell St Unit B
- 53 Crestview Rd
- 58 Alpine St
- 31 Greensbrook Way
- 39 Forest St Unit 39A
- 4 Beck Rd
Your Personal Tour Guide
Ask me questions while you tour the home.