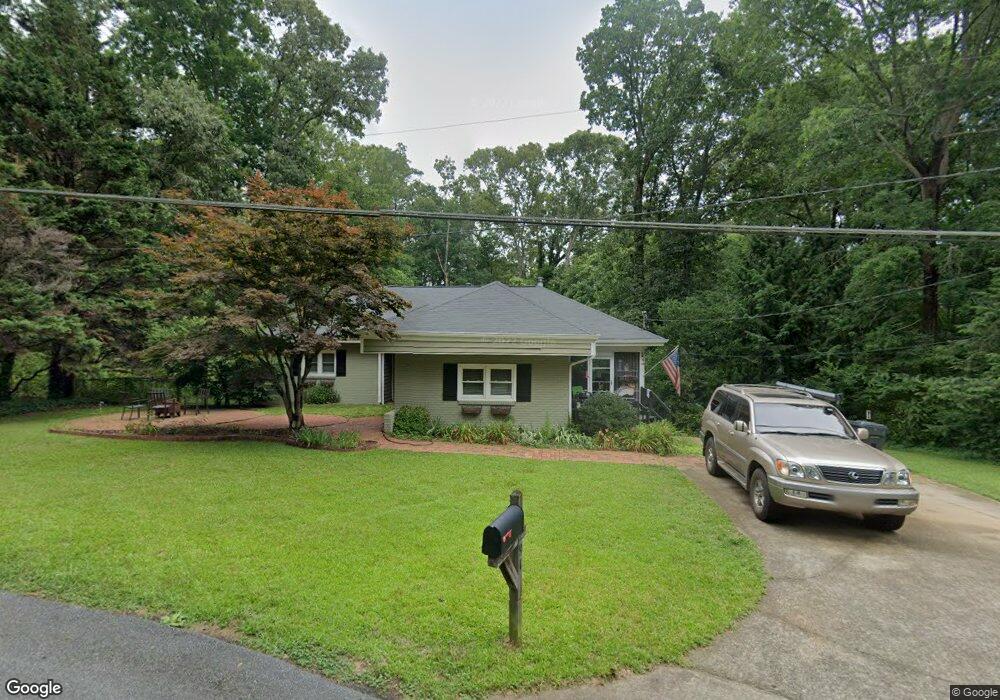
291 Ivey Dr Canton, GA 30114
Estimated Value: $315,200 - $332,000
3
Beds
2
Baths
1,452
Sq Ft
$223/Sq Ft
Est. Value
About This Home
This home is located at 291 Ivey Dr, Canton, GA 30114 and is currently estimated at $323,600, approximately $222 per square foot. 291 Ivey Dr is a home located in Cherokee County with nearby schools including Hasty Elementary School Fine Arts Academy, Teasley Middle School, and Cherokee High School.
Ownership History
Date
Name
Owned For
Owner Type
Purchase Details
Closed on
Jun 24, 2016
Sold by
Mcgowan Steven A
Bought by
Payne Justin G
Current Estimated Value
Home Financials for this Owner
Home Financials are based on the most recent Mortgage that was taken out on this home.
Original Mortgage
$178,703
Outstanding Balance
$140,901
Interest Rate
3.37%
Mortgage Type
FHA
Estimated Equity
$182,699
Purchase Details
Closed on
Aug 31, 1999
Sold by
Dobbs Claude and Dobbs Lilah S
Bought by
Mcgowan Steve A and Mcgowan Shannon B
Home Financials for this Owner
Home Financials are based on the most recent Mortgage that was taken out on this home.
Original Mortgage
$91,350
Interest Rate
7.88%
Purchase Details
Closed on
Mar 16, 1999
Sold by
Crawford Rex A and Crawford Kathleen
Bought by
Dobbs Claude and Dobbs Lilak S
Home Financials for this Owner
Home Financials are based on the most recent Mortgage that was taken out on this home.
Original Mortgage
$70,000
Interest Rate
7.13%
Create a Home Valuation Report for This Property
The Home Valuation Report is an in-depth analysis detailing your home's value as well as a comparison with similar homes in the area
Home Values in the Area
Average Home Value in this Area
Purchase History
| Date | Buyer | Sale Price | Title Company |
|---|---|---|---|
| Payne Justin G | $182,000 | -- | |
| Mcgowan Steve A | $101,500 | -- | |
| Dobbs Claude | $87,500 | -- |
Source: Public Records
Mortgage History
| Date | Status | Borrower | Loan Amount |
|---|---|---|---|
| Open | Payne Justin G | $178,703 | |
| Previous Owner | Mcgowan Steve A | $91,350 | |
| Previous Owner | Dobbs Claude | $70,000 |
Source: Public Records
Tax History
| Year | Tax Paid | Tax Assessment Tax Assessment Total Assessment is a certain percentage of the fair market value that is determined by local assessors to be the total taxable value of land and additions on the property. | Land | Improvement |
|---|---|---|---|---|
| 2025 | $3,135 | $125,528 | $16,480 | $109,048 |
| 2024 | $2,973 | $116,888 | $13,320 | $103,568 |
| 2023 | $2,218 | $105,368 | $10,720 | $94,648 |
| 2022 | $2,191 | $83,648 | $10,320 | $73,328 |
| 2021 | $1,933 | $67,928 | $8,600 | $59,328 |
| 2020 | $1,750 | $60,648 | $8,600 | $52,048 |
| 2019 | $1,622 | $55,520 | $8,600 | $46,920 |
| 2018 | $1,639 | $53,360 | $8,600 | $44,760 |
| 2017 | $1,667 | $134,800 | $8,600 | $45,320 |
| 2016 | $841 | $88,200 | $7,200 | $28,080 |
| 2015 | $850 | $88,400 | $6,800 | $28,560 |
| 2014 | $1,010 | $83,600 | $5,600 | $27,840 |
Source: Public Records
Map
Nearby Homes
- 3050 Marietta Hwy
- 3026 Marietta Hwy
- 286 Hilton Way
- 253 Woodland Way
- 374 S Mccollum Dr
- 362 S Mccollum Dr
- 1480 Pine Lark Dr
- 1480 Pine Lark Dr Unit LOT 22
- 342 S Mccollum Dr
- 324 S Mccollum Dr
- 216 Piedmont Cir
- 1521 Larkwood Dr
- 511 Autumn Echo
- 256 Butterworth Rd
- 100 Bridgeview (Lot 1) Way
- 112 Way
- 144 Bridgeview (Lot 12) Way
- 284 Cottonwood Creek Cir
- 118 Celebration Song
- 407 Cherubs Smile
- 0 Ivey Dr Unit 8571927
- 0 Ivey Dr
- 248 Pine Crest Dr
- 257 Ivey Dr
- 266 Pine Crest Dr
- 201 Ivey Dr
- 245 Pine Crest Dr
- 265 Pine Crest Dr
- 278 Pine Crest Dr
- 199 Ivey Dr
- 417 Ivey Dr
- 169 Ivey Dr
- 414 Ivey Dr
- 275 Pine Crest Dr
- 150 Ivey Dr
- 2905 Marietta Hwy
- 505 Sunset Dr
- 2765 Marietta Hwy
- 237 Sunset Dr
- 2751 Marietta Hwy
Your Personal Tour Guide
Ask me questions while you tour the home.