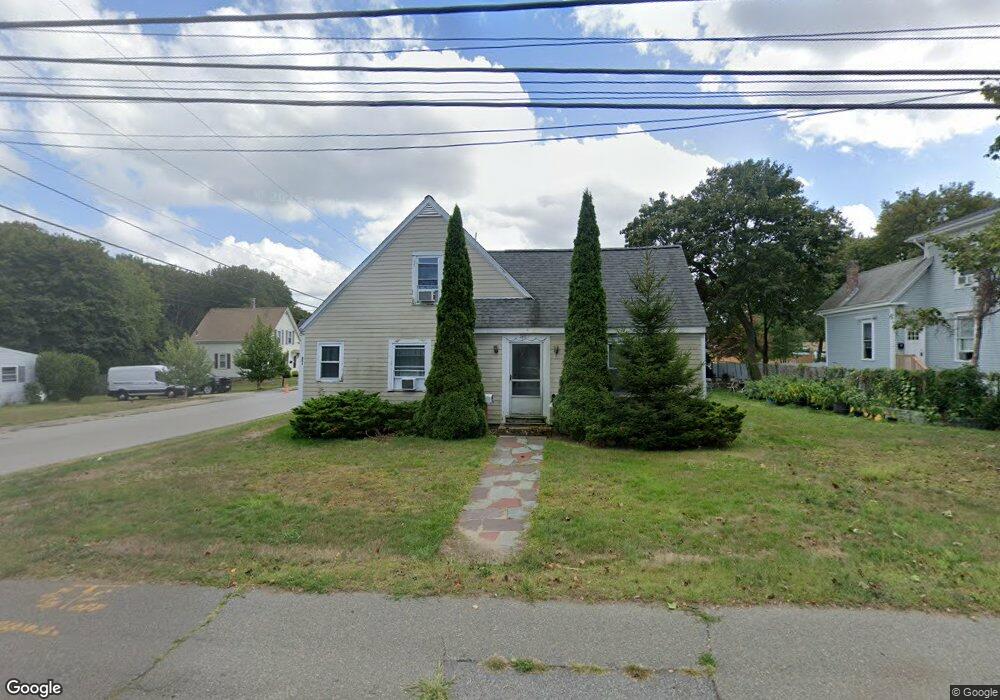
291 Market St Rockland, MA 02370
Estimated Value: $549,000 - $668,000
2
Beds
2
Baths
1,644
Sq Ft
$362/Sq Ft
Est. Value
About This Home
This home is located at 291 Market St, Rockland, MA 02370 and is currently estimated at $594,770, approximately $361 per square foot. 291 Market St is a home located in Plymouth County with nearby schools including Rockland Senior High School, Calvary Chapel Academy, and Holy Family Elementary School.
Ownership History
Date
Name
Owned For
Owner Type
Purchase Details
Closed on
Feb 25, 2002
Sold by
Wass Jonathan R
Bought by
Seqheto Jose Carlos
Current Estimated Value
Home Financials for this Owner
Home Financials are based on the most recent Mortgage that was taken out on this home.
Original Mortgage
$179,900
Interest Rate
7.08%
Mortgage Type
Purchase Money Mortgage
Purchase Details
Closed on
Nov 5, 1993
Sold by
Staples Garry R and Staples Carolyn J
Bought by
Wass Jonathan R
Create a Home Valuation Report for This Property
The Home Valuation Report is an in-depth analysis detailing your home's value as well as a comparison with similar homes in the area
Home Values in the Area
Average Home Value in this Area
Purchase History
| Date | Buyer | Sale Price | Title Company |
|---|---|---|---|
| Seqheto Jose Carlos | $224,900 | -- | |
| Wass Jonathan R | $90,000 | -- |
Source: Public Records
Mortgage History
| Date | Status | Borrower | Loan Amount |
|---|---|---|---|
| Open | Wass Jonathan R | $37,100 | |
| Open | Wass Jonathan R | $231,000 | |
| Closed | Wass Jonathan R | $179,900 | |
| Closed | Wass Jonathan R | $33,700 |
Source: Public Records
Tax History Compared to Growth
Tax History
| Year | Tax Paid | Tax Assessment Tax Assessment Total Assessment is a certain percentage of the fair market value that is determined by local assessors to be the total taxable value of land and additions on the property. | Land | Improvement |
|---|---|---|---|---|
| 2025 | $6,634 | $485,300 | $214,900 | $270,400 |
| 2024 | $6,490 | $461,600 | $202,700 | $258,900 |
| 2023 | $6,301 | $414,000 | $176,200 | $237,800 |
| 2022 | $6,085 | $363,300 | $153,200 | $210,100 |
| 2021 | $5,569 | $322,300 | $139,200 | $183,100 |
| 2020 | $5,373 | $307,000 | $132,600 | $174,400 |
| 2019 | $5,102 | $284,700 | $126,300 | $158,400 |
| 2018 | $4,817 | $264,400 | $126,300 | $138,100 |
| 2017 | $4,657 | $252,000 | $126,300 | $125,700 |
| 2016 | $4,506 | $243,700 | $121,500 | $122,200 |
| 2015 | $4,504 | $236,700 | $113,500 | $123,200 |
| 2014 | $4,257 | $232,100 | $111,300 | $120,800 |
Source: Public Records
Map
Nearby Homes
- 94-96 Crescent St
- 133 Crescent St
- 149 Concord St
- 440 Market St
- 92 Liberty St
- 49 Liberty St
- 140 W Water St
- 133 Spring St
- 50 Linden Park
- 38 Levin Rd
- 225 W Water St
- 103 Grove St Unit 337
- 45-47 Park St
- 119 Grove St Unit 238
- 119 Grove St Unit 223
- 135 Grove St Unit 110
- 20 Pat Rose Way
- 19 Pat Rose Way
- 6 Pat Rose Way
- 63 Webster St
- 283 Market St Unit 2
- 283 Market St
- 283 Market St Unit 3
- 283 Market St Unit 1
- 15 Albion St
- 303 Market St
- 16 Albion St
- 275 Market St Unit 2
- 275 Market St
- 275 Market St Unit B
- 23 Albion St
- 311 Market St
- 304 Market St
- 282 Market St
- 24 Albion St
- 261 Market St
- 30 Albion St
- 292 Market St
- 35 Albion St
- 270 Market St