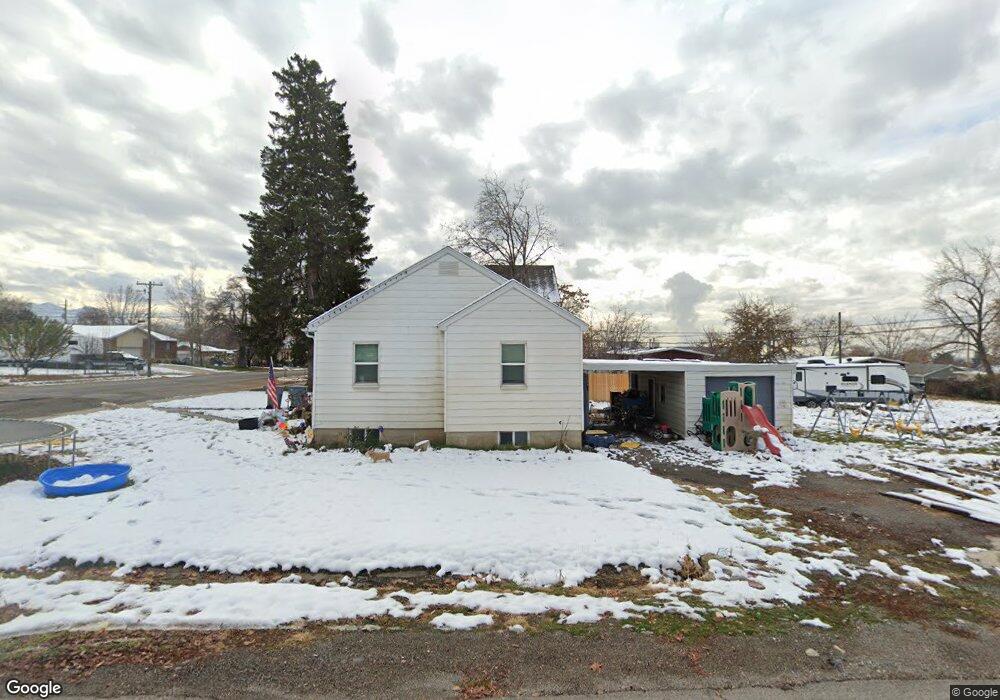
291 N 400 E Pleasant Grove, UT 84062
Estimated Value: $373,000 - $514,000
4
Beds
2
Baths
1,552
Sq Ft
$281/Sq Ft
Est. Value
About This Home
This home is located at 291 N 400 E, Pleasant Grove, UT 84062 and is currently estimated at $435,540, approximately $280 per square foot. 291 N 400 E is a home located in Utah County with nearby schools including Grovecrest Elementary School, Pleasant Grove Junior High School, and Pleasant Grove High School.
Ownership History
Date
Name
Owned For
Owner Type
Purchase Details
Closed on
May 5, 2023
Sold by
Evans Nathaniel C and Evans Katrese S
Bought by
Evans Katrese Susan
Current Estimated Value
Home Financials for this Owner
Home Financials are based on the most recent Mortgage that was taken out on this home.
Original Mortgage
$278,795
Outstanding Balance
$270,943
Interest Rate
6.32%
Mortgage Type
FHA
Estimated Equity
$164,597
Purchase Details
Closed on
Dec 29, 2008
Sold by
Davis Dean Richard and Davis Camille L
Bought by
Evans Nathaniel C and Evans Katrese S
Home Financials for this Owner
Home Financials are based on the most recent Mortgage that was taken out on this home.
Original Mortgage
$154,600
Interest Rate
5.97%
Mortgage Type
Purchase Money Mortgage
Purchase Details
Closed on
Jun 16, 2005
Sold by
Vest Marcia W
Bought by
Wadley Jerry R and Wadley Shirley Lillian
Create a Home Valuation Report for This Property
The Home Valuation Report is an in-depth analysis detailing your home's value as well as a comparison with similar homes in the area
Home Values in the Area
Average Home Value in this Area
Purchase History
| Date | Buyer | Sale Price | Title Company |
|---|---|---|---|
| Evans Katrese Susan | -- | Title Guarantee | |
| Evans Nathaniel C | -- | Title West Title Company | |
| Wadley Jerry R | -- | -- | |
| Wadley Jerry R | -- | -- |
Source: Public Records
Mortgage History
| Date | Status | Borrower | Loan Amount |
|---|---|---|---|
| Open | Evans Katrese Susan | $278,795 | |
| Previous Owner | Evans Nathaniel C | $154,600 |
Source: Public Records
Tax History Compared to Growth
Tax History
| Year | Tax Paid | Tax Assessment Tax Assessment Total Assessment is a certain percentage of the fair market value that is determined by local assessors to be the total taxable value of land and additions on the property. | Land | Improvement |
|---|---|---|---|---|
| 2025 | $1,568 | $210,705 | $192,200 | $190,900 |
| 2024 | $1,568 | $187,000 | $0 | $0 |
| 2023 | $1,500 | $183,205 | $0 | $0 |
| 2022 | $1,550 | $188,430 | $0 | $0 |
| 2021 | $1,334 | $247,000 | $137,900 | $109,100 |
| 2020 | $1,225 | $222,300 | $123,100 | $99,200 |
| 2019 | $1,063 | $199,400 | $113,100 | $86,300 |
| 2018 | $1,004 | $178,200 | $103,200 | $75,000 |
| 2017 | $923 | $87,230 | $0 | $0 |
| 2016 | $925 | $84,315 | $0 | $0 |
| 2015 | $976 | $84,315 | $0 | $0 |
| 2014 | $973 | $83,215 | $0 | $0 |
Source: Public Records
Map
Nearby Homes