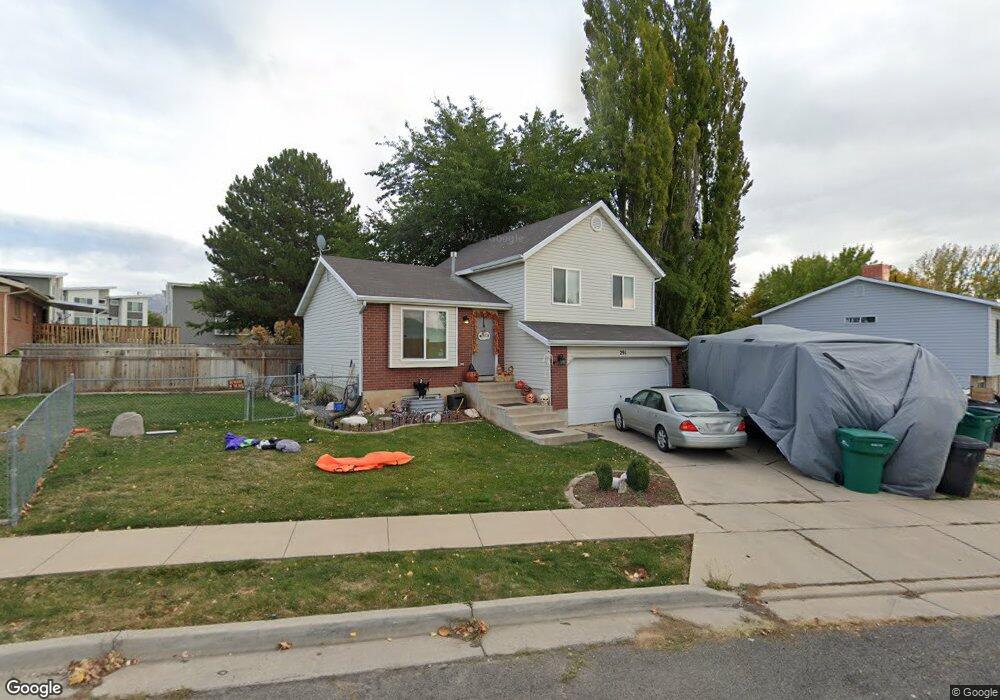
291 N 400 W Clearfield, UT 84015
Estimated Value: $422,000 - $457,000
4
Beds
2
Baths
2,006
Sq Ft
$215/Sq Ft
Est. Value
About This Home
This home is located at 291 N 400 W, Clearfield, UT 84015 and is currently estimated at $431,068, approximately $214 per square foot. 291 N 400 W is a home located in Davis County with nearby schools including Holt Elementary School, North Davis Junior High School, and Clearfield High School.
Ownership History
Date
Name
Owned For
Owner Type
Purchase Details
Closed on
Sep 27, 2010
Sold by
Secretary Of Veterans Affairs
Bought by
Morby Zachary and Morby Callie
Current Estimated Value
Home Financials for this Owner
Home Financials are based on the most recent Mortgage that was taken out on this home.
Original Mortgage
$112,485
Outstanding Balance
$73,849
Interest Rate
4.25%
Mortgage Type
FHA
Estimated Equity
$357,219
Purchase Details
Closed on
Aug 12, 2009
Sold by
Stefani James R
Bought by
Secretary Of Veterans Affairs
Purchase Details
Closed on
Oct 23, 2002
Sold by
Federal Home Loan Mortgage Corporation
Bought by
Stefani James R
Home Financials for this Owner
Home Financials are based on the most recent Mortgage that was taken out on this home.
Original Mortgage
$114,240
Interest Rate
6.03%
Mortgage Type
VA
Purchase Details
Closed on
Mar 16, 1998
Sold by
Luken Konrad Otto Lindbloom
Bought by
Fishburn Lane
Create a Home Valuation Report for This Property
The Home Valuation Report is an in-depth analysis detailing your home's value as well as a comparison with similar homes in the area
Home Values in the Area
Average Home Value in this Area
Purchase History
| Date | Buyer | Sale Price | Title Company |
|---|---|---|---|
| Morby Zachary | -- | First American Title | |
| Secretary Of Veterans Affairs | $117,307 | Backman Title Services | |
| Stefani James R | -- | Title West Title Company | |
| Fishburn Lane | -- | Guardian Title Company |
Source: Public Records
Mortgage History
| Date | Status | Borrower | Loan Amount |
|---|---|---|---|
| Open | Morby Zachary | $112,485 | |
| Previous Owner | Stefani James R | $114,240 |
Source: Public Records
Tax History Compared to Growth
Tax History
| Year | Tax Paid | Tax Assessment Tax Assessment Total Assessment is a certain percentage of the fair market value that is determined by local assessors to be the total taxable value of land and additions on the property. | Land | Improvement |
|---|---|---|---|---|
| 2025 | $2,320 | $207,900 | $63,683 | $144,217 |
| 2024 | $2,236 | $201,850 | $60,918 | $140,932 |
| 2023 | $2,064 | $342,000 | $97,970 | $244,030 |
| 2022 | $2,259 | $202,400 | $56,583 | $145,817 |
| 2021 | $2,068 | $280,000 | $57,689 | $222,311 |
| 2020 | $1,889 | $254,000 | $48,070 | $205,930 |
| 2019 | $1,816 | $241,000 | $52,041 | $188,959 |
| 2018 | $1,647 | $213,000 | $46,192 | $166,808 |
| 2016 | $1,468 | $99,275 | $18,288 | $80,987 |
| 2015 | $1,370 | $88,330 | $18,288 | $70,042 |
| 2014 | $1,232 | $80,463 | $18,288 | $62,175 |
| 2013 | -- | $82,144 | $29,325 | $52,819 |
Source: Public Records
Map
Nearby Homes