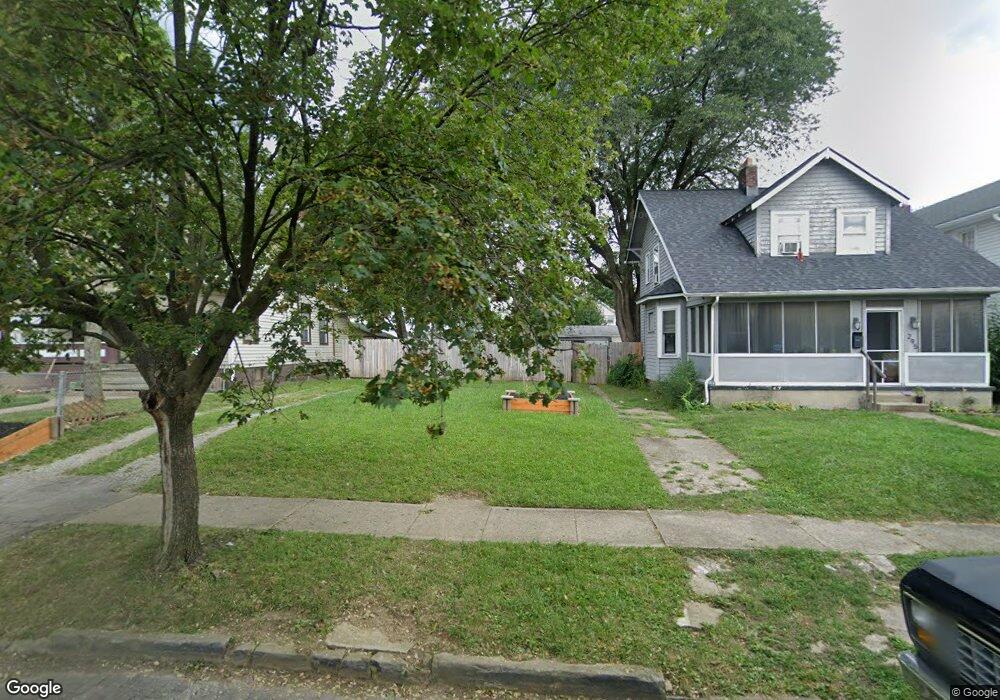
291 N Ogden Ave Columbus, OH 43204
North Hilltop NeighborhoodEstimated Value: $44,000 - $271,000
2
Beds
2
Baths
1,080
Sq Ft
$153/Sq Ft
Est. Value
About This Home
This home is located at 291 N Ogden Ave, Columbus, OH 43204 and is currently estimated at $165,000, approximately $152 per square foot. 291 N Ogden Ave is a home located in Franklin County with nearby schools including West Broad Elementary School, Westmoor Middle School, and West High School.
Ownership History
Date
Name
Owned For
Owner Type
Purchase Details
Closed on
Jan 31, 2020
Sold by
Benjamin Russell D and Bennett Stephanie
Bought by
Brown Thomas A and Brown Britteny R
Current Estimated Value
Home Financials for this Owner
Home Financials are based on the most recent Mortgage that was taken out on this home.
Original Mortgage
$71,610
Outstanding Balance
$63,307
Interest Rate
3.74%
Mortgage Type
VA
Estimated Equity
$101,693
Purchase Details
Closed on
Aug 30, 2018
Sold by
Central Ohio Community Improvement Corp
Bought by
Benjamin Russell D
Purchase Details
Closed on
Dec 12, 2015
Sold by
Muncipal Tax Investment Llc
Bought by
Mitchen Heather H and Mitchen Heather
Purchase Details
Closed on
Mar 18, 1986
Bought by
Mitchem Heather H
Create a Home Valuation Report for This Property
The Home Valuation Report is an in-depth analysis detailing your home's value as well as a comparison with similar homes in the area
Home Values in the Area
Average Home Value in this Area
Purchase History
| Date | Buyer | Sale Price | Title Company |
|---|---|---|---|
| Brown Thomas A | $70,000 | Valmer Land Title | |
| Benjamin Russell D | -- | None Available | |
| Mitchen Heather H | -- | None Available | |
| Mitchem Heather H | -- | -- |
Source: Public Records
Mortgage History
| Date | Status | Borrower | Loan Amount |
|---|---|---|---|
| Open | Brown Thomas A | $71,610 |
Source: Public Records
Tax History Compared to Growth
Tax History
| Year | Tax Paid | Tax Assessment Tax Assessment Total Assessment is a certain percentage of the fair market value that is determined by local assessors to be the total taxable value of land and additions on the property. | Land | Improvement |
|---|---|---|---|---|
| 2024 | $481 | $5,150 | $5,150 | -- |
| 2023 | $233 | $5,145 | $5,145 | $0 |
| 2022 | $154 | $1,930 | $1,930 | $0 |
| 2021 | $103 | $1,930 | $1,930 | $0 |
| 2020 | $103 | $1,930 | $1,930 | $0 |
| 2019 | $879 | $1,610 | $1,610 | $0 |
| 2018 | $879 | $8,230 | $1,610 | $6,620 |
| 2017 | $0 | $8,230 | $1,610 | $6,620 |
| 2016 | $2,677 | $15,690 | $3,890 | $11,800 |
| 2015 | $1,758 | $15,690 | $3,890 | $11,800 |
| 2014 | $973 | $15,690 | $3,890 | $11,800 |
| 2013 | $727 | $18,410 | $4,550 | $13,860 |
Source: Public Records
Map
Nearby Homes
- 298 N Burgess Ave
- 200-202 N Harris Ave
- 166 N Harris Ave
- 127 N Burgess Ave
- 118 N Ogden Ave
- 2578 Elliott Ave
- 104-106 N Hague Ave
- 87 N Warren Ave
- 78 N Burgess Ave
- 285 N Wayne Ave
- 75 N Terrace Ave
- 149 N Eureka Ave
- 188 N Eureka Ave
- 274 N Wayne Ave
- 2360 Westwood Dr
- 184 N Roys Ave
- 162 S Roys Ave
- 120 N Eureka Ave Unit 122
- 527 N Hague Ave
- 146 N Wayne Ave
- 295 N Ogden Ave
- 287 N Ogden Ave
- 299 & 301 N Ogden Ave
- 299-301 N Ogden Ave
- 299 N Ogden Ave Unit 301
- 299 N Ogden Ave Unit 3
- 281 N Ogden Ave
- 307 N Ogden Ave Unit 307
- 275 N Ogden Ave Unit 277
- 311 N Ogden Ave
- 271 N Ogden Ave Unit 273
- 294 N Ogden Ave
- 298 N Ogden Ave
- 288 N Ogden Ave
- 292 N Warren Ave Unit 294
- 288 N Warren Ave
- 317 N Ogden Ave
- 304 N Ogden Ave
- 282 N Warren Ave Unit 284
- 298 N Warren Ave