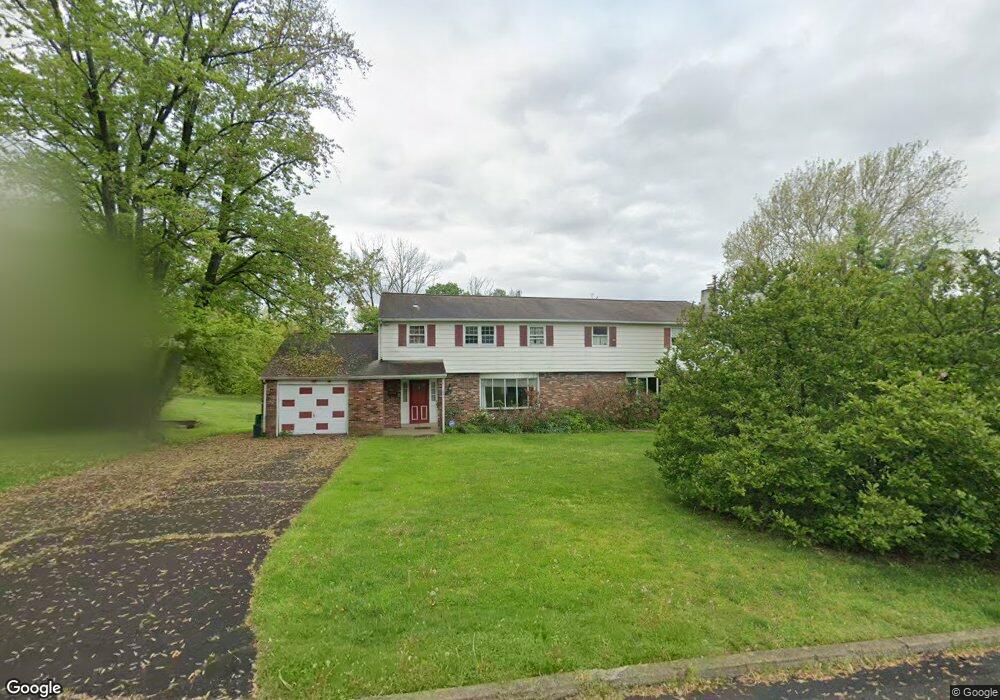
291 Penncrest Dr Langhorne, PA 19047
Estimated Value: $541,000 - $728,409
8
Beds
4
Baths
3,464
Sq Ft
$184/Sq Ft
Est. Value
About This Home
This home is located at 291 Penncrest Dr, Langhorne, PA 19047 and is currently estimated at $636,102, approximately $183 per square foot. 291 Penncrest Dr is a home located in Bucks County with nearby schools including Pearl S. Buck Elementary School, Maple Point Middle School, and Neshaminy High School.
Ownership History
Date
Name
Owned For
Owner Type
Purchase Details
Closed on
May 8, 2023
Sold by
Karmilowicz Elaine D
Bought by
Ryan Shawn and Bongiorno Patricia
Current Estimated Value
Home Financials for this Owner
Home Financials are based on the most recent Mortgage that was taken out on this home.
Original Mortgage
$485,545
Outstanding Balance
$471,871
Interest Rate
6.32%
Mortgage Type
New Conventional
Estimated Equity
$164,231
Purchase Details
Closed on
Feb 16, 1998
Sold by
New York & Philadelphia Synod Reformed E
Bought by
Woods Michael S and Dougan Marcia
Purchase Details
Closed on
Dec 3, 1973
Bought by
Karmilowicz Norman Peter and Karmilowicz Elaine
Create a Home Valuation Report for This Property
The Home Valuation Report is an in-depth analysis detailing your home's value as well as a comparison with similar homes in the area
Home Values in the Area
Average Home Value in this Area
Purchase History
| Date | Buyer | Sale Price | Title Company |
|---|---|---|---|
| Ryan Shawn | $511,100 | Title Services | |
| Woods Michael S | $131,500 | -- | |
| Karmilowicz Norman Peter | -- | -- |
Source: Public Records
Mortgage History
| Date | Status | Borrower | Loan Amount |
|---|---|---|---|
| Open | Ryan Shawn | $485,545 |
Source: Public Records
Tax History
| Year | Tax Paid | Tax Assessment Tax Assessment Total Assessment is a certain percentage of the fair market value that is determined by local assessors to be the total taxable value of land and additions on the property. | Land | Improvement |
|---|---|---|---|---|
| 2025 | $10,014 | $32,080 | $7,360 | $24,720 |
| 2024 | $10,014 | $46,000 | $7,360 | $38,640 |
| 2023 | $9,856 | $46,000 | $7,360 | $38,640 |
| 2022 | $9,597 | $46,000 | $7,360 | $38,640 |
| 2021 | $9,597 | $46,000 | $7,360 | $38,640 |
| 2020 | $9,482 | $46,000 | $7,360 | $38,640 |
| 2019 | $9,270 | $46,000 | $7,360 | $38,640 |
| 2018 | $9,100 | $46,000 | $7,360 | $38,640 |
| 2017 | $8,867 | $46,000 | $7,360 | $38,640 |
| 2016 | $8,867 | $46,000 | $7,360 | $38,640 |
| 2015 | $9,057 | $46,000 | $7,360 | $38,640 |
| 2014 | $9,057 | $46,000 | $7,360 | $38,640 |
Source: Public Records
Map
Nearby Homes
- 413 N Pine St
- 209 N Bellevue Ave
- 311 Saint James Dr Unit 11
- 18 Golf Club Dr
- 67 Black Eyed Susan Rd
- 627 Bellflower Rd Unit V260
- 618 Bellflower Rd Unit V229
- 1021 W Maple Ave
- 216 Hampton Dr
- 629 S Bellevue Ave Unit B
- 565 Hulmeville Rd
- 166 N Hawthorne Ave
- 222 Green Valley Rd
- 1 Costa Ct
- 1836 3rd St
- 543 Green Valley Rd
- 827 Hulmeville Rd
- 527 Aldrich Cir Unit HOMESITE 37
- 866 Hulmeville Rd
- 302 Kyle Ln
- 281 Penncrest Dr
- 301 Penncrest Dr
- 267 Penncrest Dr
- 310 Penncrest Dr
- 309 Penncrest Dr
- 301 Greenridge Dr
- 247 Penncrest Dr
- 320 Penncrest Dr
- 321 Penncrest Dr
- 321 Greenridge Dr
- 300 Greenridge Dr
- 219 Summit Ave
- 248 Penncrest Dr
- 337 Greenridge Dr
- 314 Greenridge Dr
- 335 Penncrest Dr
- 247 Summit Ave
- 328 Greenridge Dr
- 62 Country Club Ln
- 273 Summit Ave
Your Personal Tour Guide
Ask me questions while you tour the home.