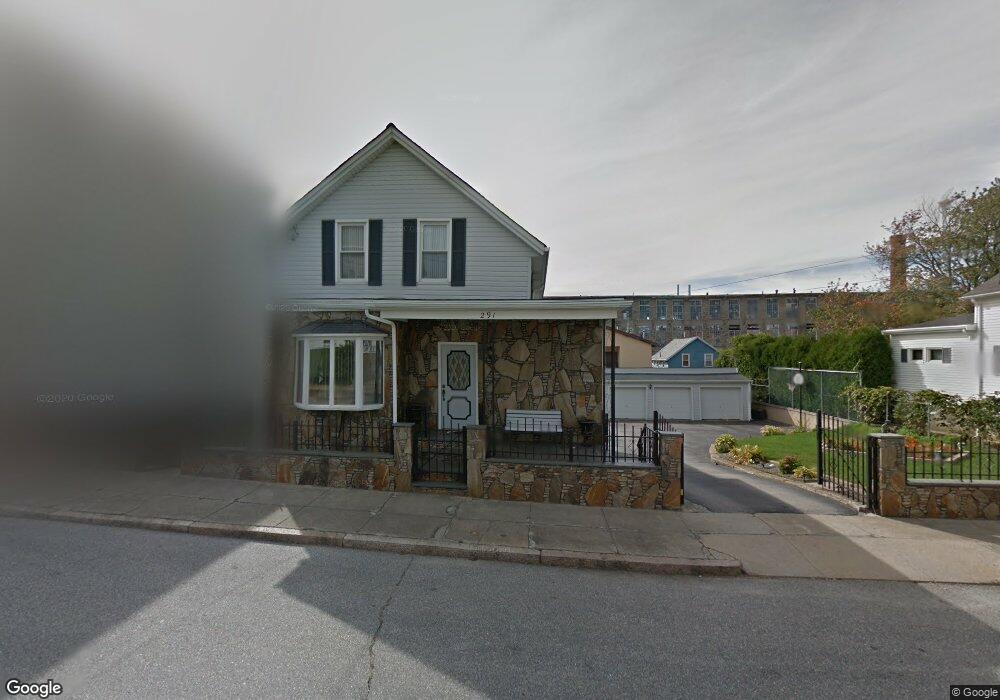
291 Pitman St Fall River, MA 02723
Flint NeighborhoodEstimated Value: $380,000 - $429,604
3
Beds
2
Baths
1,877
Sq Ft
$216/Sq Ft
Est. Value
About This Home
This home is located at 291 Pitman St, Fall River, MA 02723 and is currently estimated at $404,651, approximately $215 per square foot. 291 Pitman St is a home located in Bristol County with nearby schools including Samuel Watson, Talbot Innovation School, and B M C Durfee High School.
Ownership History
Date
Name
Owned For
Owner Type
Purchase Details
Closed on
Nov 27, 2015
Sold by
Pimentel Carlos M and Pimentel Maria N
Bought by
Pimentel Carlos M and Pimentel Maria N
Current Estimated Value
Purchase Details
Closed on
Apr 28, 1976
Bought by
Pimentel Carlos M and Pimentel Maria N
Create a Home Valuation Report for This Property
The Home Valuation Report is an in-depth analysis detailing your home's value as well as a comparison with similar homes in the area
Home Values in the Area
Average Home Value in this Area
Purchase History
| Date | Buyer | Sale Price | Title Company |
|---|---|---|---|
| Pimentel Carlos M | -- | -- | |
| Pimentel Carlos M | $20,500 | -- |
Source: Public Records
Mortgage History
| Date | Status | Borrower | Loan Amount |
|---|---|---|---|
| Previous Owner | Pimentel Carlos M | $50,000 | |
| Previous Owner | Pimentel Carlos M | $7,000 |
Source: Public Records
Tax History
| Year | Tax Paid | Tax Assessment Tax Assessment Total Assessment is a certain percentage of the fair market value that is determined by local assessors to be the total taxable value of land and additions on the property. | Land | Improvement |
|---|---|---|---|---|
| 2025 | $3,663 | $319,900 | $111,400 | $208,500 |
| 2024 | $3,458 | $301,000 | $107,300 | $193,700 |
| 2023 | $3,060 | $249,400 | $88,700 | $160,700 |
| 2022 | $2,879 | $228,100 | $84,400 | $143,700 |
| 2021 | $2,711 | $196,000 | $80,300 | $115,700 |
| 2020 | $2,744 | $189,900 | $79,200 | $110,700 |
| 2019 | $2,645 | $181,400 | $76,200 | $105,200 |
| 2018 | $2,566 | $175,500 | $82,600 | $92,900 |
| 2017 | $2,393 | $170,900 | $78,700 | $92,200 |
| 2016 | $2,339 | $171,600 | $83,700 | $87,900 |
| 2015 | $2,245 | $171,600 | $83,700 | $87,900 |
| 2014 | $2,129 | $169,200 | $81,300 | $87,900 |
Source: Public Records
Map
Nearby Homes
- 3 Edgemond St
- 1792 Pleasant St Unit 1808
- 366 Alden St
- 144 Choate St
- 712 Eastern Ave
- 116 Irving St
- 38 Eaton St
- 31 Choate St
- 34 Alsop St
- 529 Eastern Ave
- 157 Earle St
- 152 Alden St
- 215 Earle St Unit 1
- 219 Earle St Unit 3
- 217 Earle St Unit 2
- 25 Lebanon St Unit D
- 25 Lebanon St Unit C
- 178 Thomas St
- 352 Barnes St
- 889 Grinnell St Unit 7
- 279 Pitman St
- 640 Alden St
- 324 E Warren St
- 303 Pitman St
- 632 Alden St
- 654 Alden St
- 654 Alden St Unit 3
- 284 Pitman St
- 257 Pitman St
- 257 Pitman St Unit 3
- 612 Alden St
- 19 Manning St Unit 1
- 19 Manning St Unit 1S
- 19 Manning St Unit 1 NORTH
- 19 Manning St Unit 2S
- 19 Manning St Unit 2N
- 19 Manning St Unit 2 NO
- 19 Manning St Unit 1 & 3
- 614 Alden St Unit 1
- 270 Pitman St
Your Personal Tour Guide
Ask me questions while you tour the home.