291 S Main St Mansfield, OH 44902
Mansfield AreaEstimated Value: $26,000 - $135,000
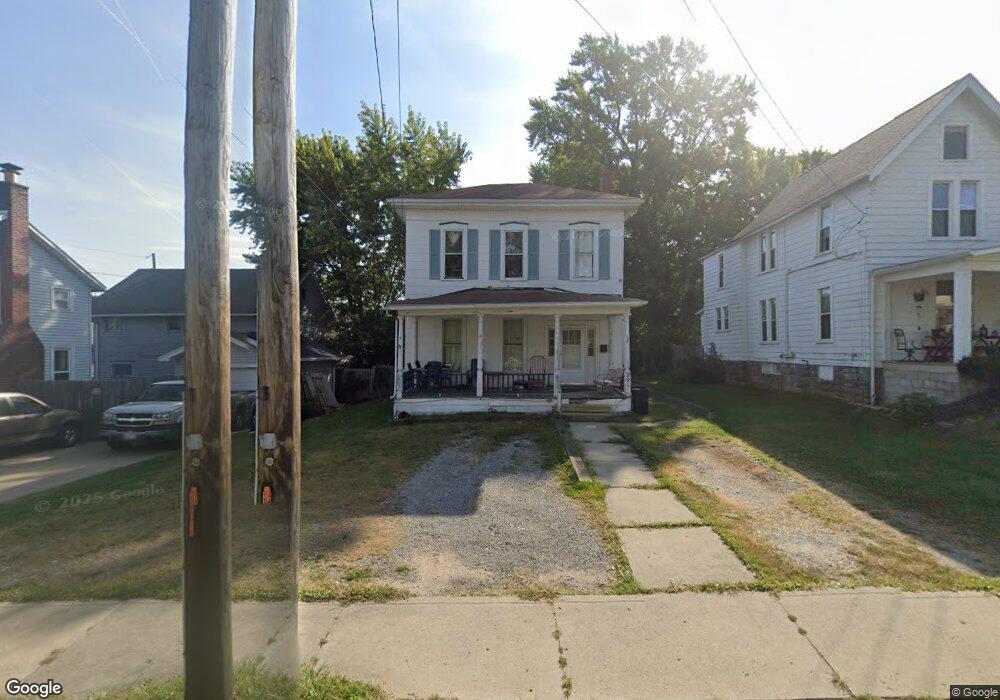
About This Home
This home is located at 291 S Main St, Mansfield, OH 44902 and is currently estimated at $84,714, approximately $45 per square foot. 291 S Main St is a home located in Richland County with nearby schools including St. Peter's Elementary/Montessori School, Discovery School, and St. Peter's Junior High / High School.
Ownership History
We collect this data history from publicly available records. To have your information removed, we recommend requesting removal directly through your county’s website.
Purchase Details
Purchase Details
Purchase Details
Purchase Details
Purchase Details
Home Values in the Area
Average Home Value in this Area
Purchase History
We collect this data history from publicly available records. To have your information removed, we recommend requesting removal directly through your county’s website.
| Date | Buyer | Sale Price | Title Company |
|---|---|---|---|
| -- | None Available | ||
| -- | None Available | ||
| $39,500 | -- | ||
| -- | -- | ||
| $21,500 | -- |
Tax History
We collect this data history from publicly available records. To have your information removed, we recommend requesting removal directly through your county’s website.
| Year | Tax Paid | Tax Assessment Tax Assessment Total Assessment is a certain percentage of the fair market value that is determined by local assessors to be the total taxable value of land and additions on the property. | Land | Improvement |
|---|---|---|---|---|
| 2025 | $942 | $19,680 | $3,780 | $15,900 |
| 2024 | $942 | $19,680 | $3,780 | $15,900 |
| 2023 | $942 | $19,680 | $3,780 | $15,900 |
| 2022 | $474 | $8,300 | $3,660 | $4,640 |
| 2021 | $477 | $8,300 | $3,660 | $4,640 |
| 2020 | $488 | $8,300 | $3,660 | $4,640 |
| 2019 | $458 | $7,030 | $3,100 | $3,930 |
| 2018 | $452 | $7,030 | $3,100 | $3,930 |
| 2017 | $440 | $7,030 | $3,100 | $3,930 |
| 2016 | $214 | $3,320 | $840 | $2,480 |
| 2015 | $205 | $3,320 | $840 | $2,480 |
| 2014 | $202 | $3,320 | $840 | $2,480 |
| 2012 | $192 | $3,500 | $890 | $2,610 |
Map
- 349 Hammond Ave
- 74 & 78 Lexington Ave
- 377 S Main St
- 26 Maple Place
- 212 S Main St
- 394 S Main St
- 14 Flint St
- 400 Hammond Ave
- 239 S Adams St
- 121 -125 Ford St
- 121 - 125 Ford St
- 172 Lexington Ave
- 158 Ford St
- 25 E Arch St
- 219 Lexington Ave
- 167 S Adams St
- 150 Grover St
- 126 S Franklin Ave
- 123 S Franklin St
- 0 Cline Ave Hedeen Abbeyfeale Unit 9066362
Ask me questions while you tour the home.