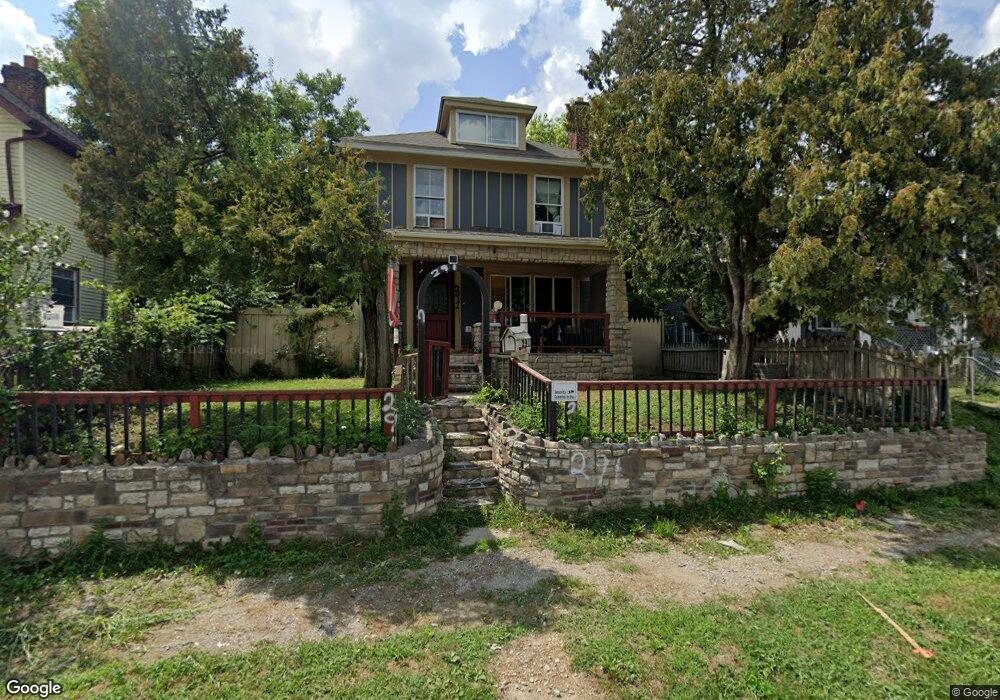
291 S Richardson Ave Columbus, OH 43204
Central Hilltop NeighborhoodEstimated Value: $102,000 - $172,000
3
Beds
1
Bath
1,362
Sq Ft
$104/Sq Ft
Est. Value
About This Home
This home is located at 291 S Richardson Ave, Columbus, OH 43204 and is currently estimated at $141,556, approximately $103 per square foot. 291 S Richardson Ave is a home located in Franklin County with nearby schools including Burroughs Elementary School, Hilltonia Middle School, and Briggs High School.
Ownership History
Date
Name
Owned For
Owner Type
Purchase Details
Closed on
Dec 20, 2013
Sold by
Dunn Kristin E
Bought by
Hodge Gail Jennifer
Current Estimated Value
Purchase Details
Closed on
Oct 26, 2012
Sold by
Fregozo Alvarez Raul
Bought by
Dunn Kristin E
Purchase Details
Closed on
Jun 30, 2011
Sold by
Wells Fargo Bank Na
Bought by
Fregozo Alvarez Raul
Purchase Details
Closed on
Oct 15, 2010
Sold by
Smith Karen J and Smith Rocky
Bought by
Wells Fargo Bank Na
Purchase Details
Closed on
Sep 28, 2005
Sold by
Hud
Bought by
Smith Rocky
Purchase Details
Closed on
Dec 13, 2004
Sold by
Speakman Kimberly A and Abn Amro Mortgage Group Inc
Bought by
Hud
Purchase Details
Closed on
Jun 1, 1994
Sold by
Rings Jay D
Bought by
Kimberly A Speakman
Home Financials for this Owner
Home Financials are based on the most recent Mortgage that was taken out on this home.
Original Mortgage
$41,257
Interest Rate
8.48%
Mortgage Type
FHA
Purchase Details
Closed on
Dec 1, 1985
Create a Home Valuation Report for This Property
The Home Valuation Report is an in-depth analysis detailing your home's value as well as a comparison with similar homes in the area
Home Values in the Area
Average Home Value in this Area
Purchase History
| Date | Buyer | Sale Price | Title Company |
|---|---|---|---|
| Hodge Gail Jennifer | $7,500 | None Available | |
| Dunn Kristin E | $6,000 | None Available | |
| Fregozo Alvarez Raul | $9,800 | Fidelity N | |
| Wells Fargo Bank Na | $20,000 | None Available | |
| Smith Rocky | $36,000 | Lakeside Ti | |
| Hud | $26,000 | Independent | |
| Kimberly A Speakman | $40,900 | -- | |
| -- | $20,000 | -- |
Source: Public Records
Mortgage History
| Date | Status | Borrower | Loan Amount |
|---|---|---|---|
| Previous Owner | Kimberly A Speakman | $41,257 |
Source: Public Records
Tax History Compared to Growth
Tax History
| Year | Tax Paid | Tax Assessment Tax Assessment Total Assessment is a certain percentage of the fair market value that is determined by local assessors to be the total taxable value of land and additions on the property. | Land | Improvement |
|---|---|---|---|---|
| 2024 | $3,133 | $44,670 | $6,270 | $38,400 |
| 2023 | $1,979 | $44,660 | $6,265 | $38,395 |
| 2022 | $1,651 | $21,110 | $2,100 | $19,010 |
| 2021 | $1,097 | $21,110 | $2,100 | $19,010 |
| 2020 | $1,098 | $21,110 | $2,100 | $19,010 |
| 2019 | $1,039 | $17,120 | $1,750 | $15,370 |
| 2018 | $726 | $17,120 | $1,750 | $15,370 |
| 2017 | $1,038 | $17,120 | $1,750 | $15,370 |
| 2016 | $483 | $6,900 | $4,900 | $2,000 |
| 2015 | $415 | $6,900 | $4,900 | $2,000 |
| 2014 | $416 | $6,900 | $4,900 | $2,000 |
| 2013 | $2,511 | $13,370 | $5,775 | $7,595 |
Source: Public Records
Map
Nearby Homes
- 310 S Ogden Ave
- 274 S Richardson Ave
- 350 S Ogden Ave
- 232 S Burgess Ave
- 397 S Burgess Ave
- 238 S Richardson Ave
- 405 S Burgess Ave
- 365 S Ogden Ave
- 334 S Warren Ave
- 219 S Ogden Ave
- 349 S Eureka Ave
- 224 S Terrace Ave
- 418 S Warren Ave
- 262 S Harris Ave
- 327-329 S Wayne Ave
- 444 S Warren Ave
- 337 S Wayne Ave
- 448 S Warren Ave
- 176 S Terrace Ave
- 471 S Terrace Ave Unit 473
- 285 S Richardson Ave
- 2580 Fremont St Unit 582
- 2580 Fremont St
- 299 S Richardson Ave
- 281 S Richardson Ave
- 277 S Richardson Ave
- 273 S Richardson Ave
- 2563 Fremont St
- 290 S Burgess Ave
- 296 S Burgess Ave
- 286 S Burgess Ave
- 269 S Richardson Ave
- 282 S Burgess Ave
- 278 S Burgess Ave
- 315 S Richardson Ave Unit 317
- 265 S Richardson Ave
- 294 S Richardson Ave
- 290 S Richardson Ave
- 286 S Richardson Ave
- 274 S Burgess Ave