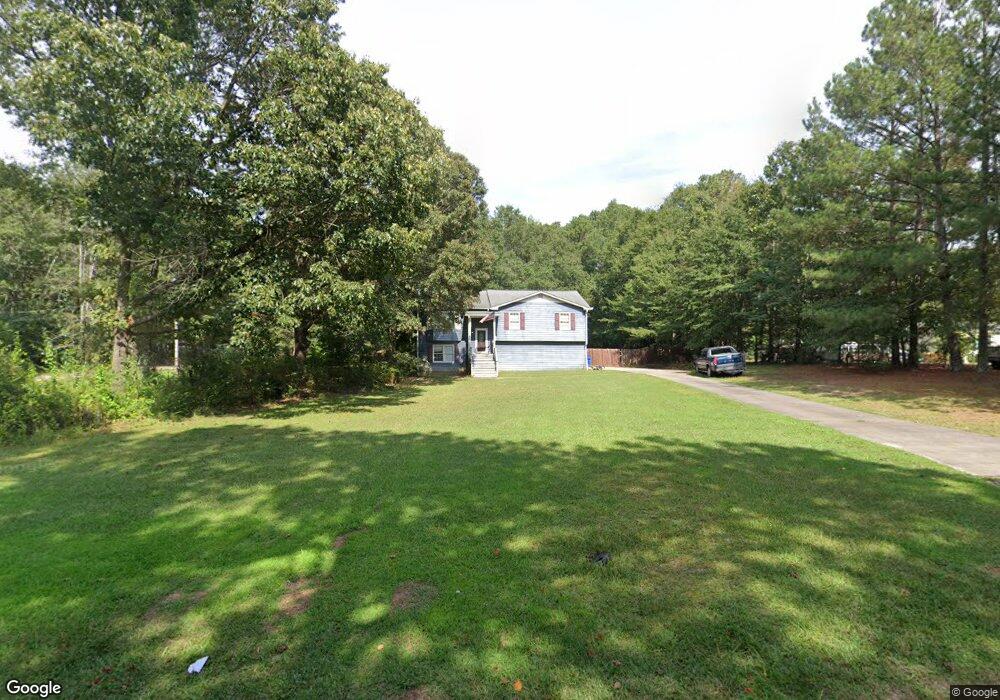
291 Union Grove Cir Auburn, GA 30011
Estimated Value: $288,000 - $314,000
3
Beds
2
Baths
1,326
Sq Ft
$226/Sq Ft
Est. Value
About This Home
This home is located at 291 Union Grove Cir, Auburn, GA 30011 and is currently estimated at $300,230, approximately $226 per square foot. 291 Union Grove Cir is a home located in Barrow County with nearby schools including Auburn Elementary School, Westside Middle School, and Apalachee High School.
Ownership History
Date
Name
Owned For
Owner Type
Purchase Details
Closed on
Jul 30, 1997
Sold by
Federal National Mortgage Association
Bought by
Oreilly Joseph A
Current Estimated Value
Home Financials for this Owner
Home Financials are based on the most recent Mortgage that was taken out on this home.
Original Mortgage
$84,050
Outstanding Balance
$12,720
Interest Rate
7.65%
Mortgage Type
New Conventional
Estimated Equity
$287,510
Purchase Details
Closed on
Jul 14, 1997
Sold by
Source One Mtg
Bought by
Federal National Mortgage Association
Home Financials for this Owner
Home Financials are based on the most recent Mortgage that was taken out on this home.
Original Mortgage
$84,050
Outstanding Balance
$12,720
Interest Rate
7.65%
Mortgage Type
New Conventional
Estimated Equity
$287,510
Purchase Details
Closed on
Apr 1, 1997
Sold by
Smith Donna
Bought by
Source One Mortgage
Purchase Details
Closed on
May 8, 1994
Bought by
Smith Donna
Create a Home Valuation Report for This Property
The Home Valuation Report is an in-depth analysis detailing your home's value as well as a comparison with similar homes in the area
Home Values in the Area
Average Home Value in this Area
Purchase History
| Date | Buyer | Sale Price | Title Company |
|---|---|---|---|
| Oreilly Joseph A | -- | -- | |
| Federal National Mortgage Association | -- | -- | |
| Source One Mortgage | $64,000 | -- | |
| Smith Donna | -- | -- |
Source: Public Records
Mortgage History
| Date | Status | Borrower | Loan Amount |
|---|---|---|---|
| Open | Oreilly Joseph A | $84,050 |
Source: Public Records
Tax History Compared to Growth
Tax History
| Year | Tax Paid | Tax Assessment Tax Assessment Total Assessment is a certain percentage of the fair market value that is determined by local assessors to be the total taxable value of land and additions on the property. | Land | Improvement |
|---|---|---|---|---|
| 2024 | $1,318 | $55,587 | $10,000 | $45,587 |
| 2023 | $901 | $55,587 | $10,000 | $45,587 |
| 2022 | $1,164 | $43,114 | $10,000 | $33,114 |
| 2021 | $1,218 | $43,114 | $10,000 | $33,114 |
| 2020 | $1,219 | $43,114 | $10,000 | $33,114 |
| 2019 | $1,104 | $38,682 | $10,000 | $28,682 |
| 2018 | $1,084 | $38,682 | $10,000 | $28,682 |
| 2017 | $1,007 | $34,598 | $10,000 | $24,598 |
| 2016 | $941 | $34,930 | $10,000 | $24,930 |
| 2015 | $955 | $35,262 | $10,000 | $25,262 |
| 2014 | $820 | $30,827 | $4,900 | $25,927 |
| 2013 | -- | $29,630 | $4,900 | $24,730 |
Source: Public Records
Map
Nearby Homes
- 270 E Union Grove Cir
- 2057 Blackberry Ln
- 331 Wages Rd
- 2063 Blackberry Ln
- 335 Wages Rd
- 539 Hayes Rd
- 1778 Wynfield Ln
- 81 Hills Shop Rd
- 491 Glen Terrace Rd
- 325 Rodeo Dr
- 315 Rodeo Dr
- 395 Rodeo Dr
- 405 Rodeo Dr
- 60 Wood Chuck Ct
- 70 Wood Chuck Ct
- 1923 Westfall Landing
- 108 Longhorn Way
- 689 Rodeo Dr
- 58 Longhorn Way
- 306 Rodeo Dr
- 285 Union Grove Cir
- 301 Union Grove Cir Unit 2
- 297 Union Grove Cir
- 292 Wages Rd
- 282 Wages Rd
- 321 Austin Way
- 302 Wages Rd Unit 1
- 323 Austin Way Unit 1
- 325 Austin Way Unit 1
- 296 Wages Rd
- 327 Austin Way
- 329 Austin Way
- 320 Austin Way
- 331 Austin Way
- 266 Wages Rd
- 322 Austin Way
- 324 Austin Way
- 299 Wages Rd
- 326 Austin Way
- 333 Austin Way Unit 1