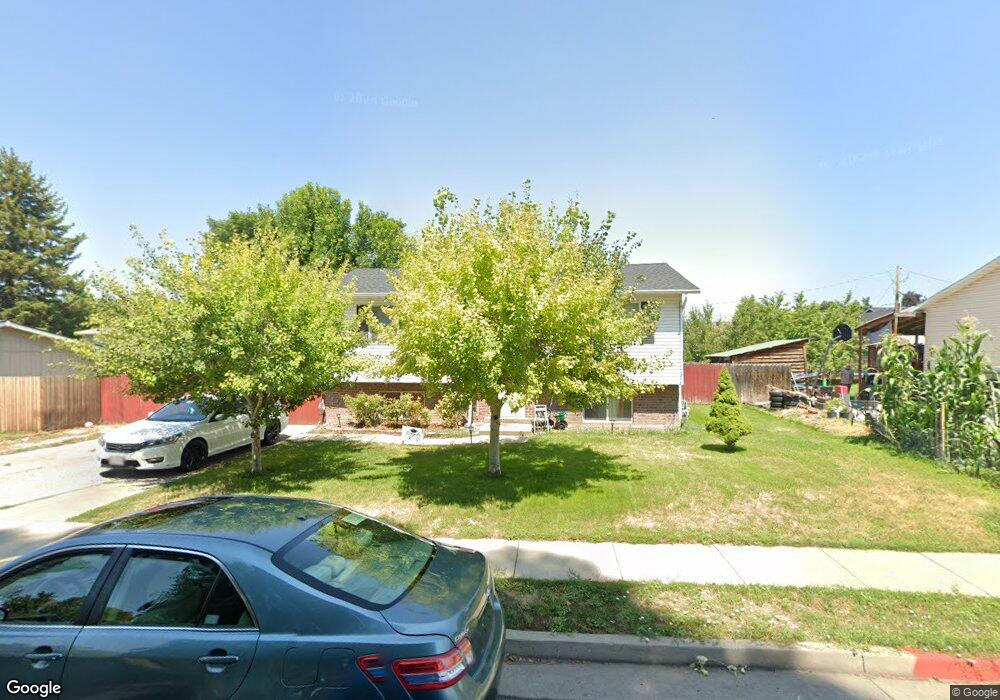
291 W 550 S Logan, UT 84321
Woodruff NeighborhoodEstimated Value: $350,000 - $371,121
3
Beds
1
Bath
1,858
Sq Ft
$193/Sq Ft
Est. Value
About This Home
This home is located at 291 W 550 S, Logan, UT 84321 and is currently estimated at $358,530, approximately $192 per square foot. 291 W 550 S is a home located in Cache County with nearby schools including Hillcrest Elementary School, Mount Logan Middle School, and Logan High School.
Ownership History
Date
Name
Owned For
Owner Type
Purchase Details
Closed on
Aug 7, 2025
Sold by
Acosta Jacqueline N and Ortiz Pedro
Bought by
Ortiz Pedro and Ortiz Jacqueline N
Current Estimated Value
Home Financials for this Owner
Home Financials are based on the most recent Mortgage that was taken out on this home.
Original Mortgage
$185,000
Outstanding Balance
$184,164
Interest Rate
6.77%
Mortgage Type
New Conventional
Estimated Equity
$174,366
Purchase Details
Closed on
May 10, 2007
Sold by
Ortiz Pedro
Bought by
Ortiz Pedro and Acosta Jacqueline N
Purchase Details
Closed on
Jan 19, 2001
Sold by
Seamons Sherwin K and Seamons Jane C
Bought by
Southam Karl L and Southam Shana R
Home Financials for this Owner
Home Financials are based on the most recent Mortgage that was taken out on this home.
Original Mortgage
$91,513
Interest Rate
7.54%
Mortgage Type
FHA
Create a Home Valuation Report for This Property
The Home Valuation Report is an in-depth analysis detailing your home's value as well as a comparison with similar homes in the area
Home Values in the Area
Average Home Value in this Area
Purchase History
| Date | Buyer | Sale Price | Title Company |
|---|---|---|---|
| Ortiz Pedro | -- | First American Title | |
| Ortiz Pedro | -- | Cache Title Company | |
| Southam Karl L | -- | American Secure Title |
Source: Public Records
Mortgage History
| Date | Status | Borrower | Loan Amount |
|---|---|---|---|
| Open | Ortiz Pedro | $185,000 | |
| Previous Owner | Southam Karl L | $91,513 |
Source: Public Records
Tax History Compared to Growth
Tax History
| Year | Tax Paid | Tax Assessment Tax Assessment Total Assessment is a certain percentage of the fair market value that is determined by local assessors to be the total taxable value of land and additions on the property. | Land | Improvement |
|---|---|---|---|---|
| 2025 | $1,531 | $198,050 | $0 | $0 |
| 2024 | $1,583 | $198,270 | $0 | $0 |
| 2023 | $163 | $194,615 | $0 | $0 |
| 2022 | $1,745 | $194,610 | $0 | $0 |
| 2021 | $1,701 | $293,075 | $50,000 | $243,075 |
| 2020 | $1,166 | $180,801 | $50,000 | $130,801 |
| 2019 | $1,219 | $180,801 | $50,000 | $130,801 |
| 2018 | $1,135 | $153,740 | $40,000 | $113,740 |
| 2017 | $1,102 | $78,870 | $0 | $0 |
| 2016 | $1,142 | $78,870 | $0 | $0 |
| 2015 | $997 | $68,765 | $0 | $0 |
| 2014 | $901 | $68,765 | $0 | $0 |
| 2013 | -- | $69,040 | $0 | $0 |
Source: Public Records
Map
Nearby Homes