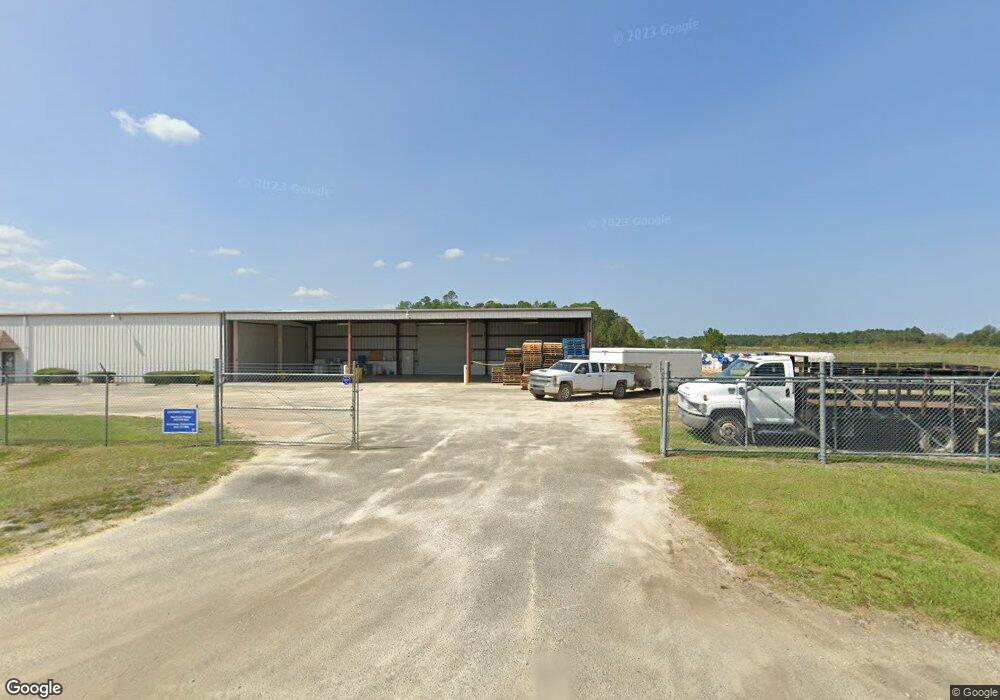
2910 Fulford Rd Waycross, GA 31503
Estimated Value: $430,394
--
Bed
--
Bath
2,400
Sq Ft
$179/Sq Ft
Est. Value
About This Home
This home is located at 2910 Fulford Rd, Waycross, GA 31503 and is currently estimated at $430,394, approximately $179 per square foot. 2910 Fulford Rd is a home located in Ware County with nearby schools including Wacona Elementary School, Ware County Middle School, and Ware County High School.
Ownership History
Date
Name
Owned For
Owner Type
Purchase Details
Closed on
Apr 9, 2021
Sold by
Robbins Donald
Bought by
Robbins Rhonda R and Rhonda R Robbins Rev Tr
Current Estimated Value
Purchase Details
Closed on
Jan 29, 2013
Sold by
Rampage Investments Inc
Bought by
Robbins Donald and Robbins Rhonda R
Purchase Details
Closed on
Apr 3, 1995
Bought by
Rampage Investments
Create a Home Valuation Report for This Property
The Home Valuation Report is an in-depth analysis detailing your home's value as well as a comparison with similar homes in the area
Home Values in the Area
Average Home Value in this Area
Purchase History
| Date | Buyer | Sale Price | Title Company |
|---|---|---|---|
| Robbins Rhonda R | -- | -- | |
| Robbins Donald | $145,000 | -- | |
| Rampage Investments | -- | -- |
Source: Public Records
Tax History Compared to Growth
Tax History
| Year | Tax Paid | Tax Assessment Tax Assessment Total Assessment is a certain percentage of the fair market value that is determined by local assessors to be the total taxable value of land and additions on the property. | Land | Improvement |
|---|---|---|---|---|
| 2024 | $3,191 | $126,475 | $17,000 | $109,475 |
| 2023 | $3,255 | $81,869 | $10,000 | $71,869 |
| 2022 | $2,364 | $81,869 | $10,000 | $71,869 |
| 2021 | $2,518 | $80,269 | $10,000 | $70,269 |
| 2020 | $2,545 | $80,269 | $10,000 | $70,269 |
| 2019 | $2,506 | $77,497 | $10,000 | $67,497 |
| 2018 | $2,529 | $77,497 | $10,000 | $67,497 |
| 2017 | $1,861 | $57,088 | $10,000 | $47,088 |
| 2016 | $1,861 | $57,088 | $10,000 | $47,088 |
| 2015 | $1,879 | $57,088 | $10,000 | $47,088 |
| 2014 | $1,876 | $57,088 | $10,000 | $47,088 |
| 2013 | -- | $57,088 | $10,000 | $47,088 |
Source: Public Records
Map
Nearby Homes
- 2836 Evergreen Rd
- 2867 Evergreen Rd
- 2885 Longwood Rd
- 850 Woodard Ln
- 1238 Red Keen Rd
- 2180 Fulford Rd Unit n/a
- 2117 Tamara Rd
- Lot 155 N Augusta Avenue Cherokee Ave
- 1261 Lake St
- 2879 Ben St
- 2869 Ben St
- 2885 Ben St
- 221 Sierra Ln
- 3648 Tanner Ln
- 3825 Jamestown Rd
- 1803 Lamar Ave
- Tract 2,3 Stetson Dr
- 3860 Blalock Ave
- 4190 Church Street Extension
- 123 Winn Clay Dr
- 3315 Fulford Rd
- 2925 Harris Rd
- 3230 Smith Dr
- 00 Industrial Blvd
- 2821 Industrial Blvd
- 2896 Cherokee St
- 3040 Cherokee St
- 2935 Cherokee St
- 2959 Cherokee St
- 1581 Highland Rd
- 2917 Cherokee St
- 2897 Cherokee St
- 2893 Cherokee St
- 2883 Cherokee St
- 3124 Cherokee St
- 2867 Cherokee St
- 3151 Industrial Blvd
- 2660 Cherokee St
- 2847 Cherokee St
- 1561 Highland Rd