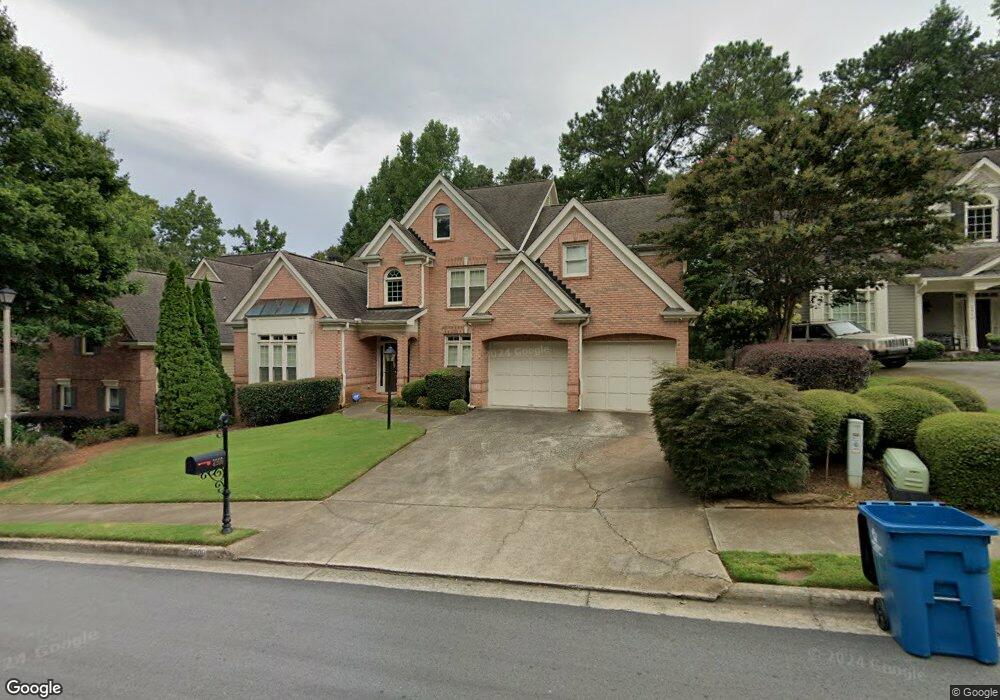
2910 Gleneagles Pointe Alpharetta, GA 30005
Windward NeighborhoodEstimated Value: $892,631 - $924,000
4
Beds
4
Baths
3,438
Sq Ft
$265/Sq Ft
Est. Value
About This Home
This home is located at 2910 Gleneagles Pointe, Alpharetta, GA 30005 and is currently estimated at $909,408, approximately $264 per square foot. 2910 Gleneagles Pointe is a home located in Fulton County with nearby schools including Creek View Elementary School, Webb Bridge Middle School, and Alpharetta High School.
Ownership History
Date
Name
Owned For
Owner Type
Purchase Details
Closed on
Apr 28, 2016
Sold by
Bryant William E
Bought by
Bryan Tracy M and Tamisin Winston David
Current Estimated Value
Purchase Details
Closed on
Apr 8, 2005
Sold by
Murphy Patrick G and Murphy Barbara
Bought by
Bryant William E and Bryant Lynn
Home Financials for this Owner
Home Financials are based on the most recent Mortgage that was taken out on this home.
Original Mortgage
$229,900
Interest Rate
5.74%
Mortgage Type
New Conventional
Purchase Details
Closed on
Sep 6, 1994
Sold by
South Colony Assoc
Bought by
Murphy Patrick G Barbara
Home Financials for this Owner
Home Financials are based on the most recent Mortgage that was taken out on this home.
Original Mortgage
$239,900
Interest Rate
7.62%
Purchase Details
Closed on
Apr 18, 1994
Sold by
Windward Props Inc
Bought by
South Colony Assoc
Create a Home Valuation Report for This Property
The Home Valuation Report is an in-depth analysis detailing your home's value as well as a comparison with similar homes in the area
Home Values in the Area
Average Home Value in this Area
Purchase History
| Date | Buyer | Sale Price | Title Company |
|---|---|---|---|
| Bryan Tracy M | $518,000 | -- | |
| Bryant William E | $429,900 | -- | |
| Murphy Patrick G Barbara | $299,900 | -- | |
| South Colony Assoc | $50,000 | -- |
Source: Public Records
Mortgage History
| Date | Status | Borrower | Loan Amount |
|---|---|---|---|
| Previous Owner | Bryant William E | $229,900 | |
| Previous Owner | Murphy Patrick G Barbara | $239,900 |
Source: Public Records
Tax History Compared to Growth
Tax History
| Year | Tax Paid | Tax Assessment Tax Assessment Total Assessment is a certain percentage of the fair market value that is determined by local assessors to be the total taxable value of land and additions on the property. | Land | Improvement |
|---|---|---|---|---|
| 2025 | $1,057 | $358,880 | $89,160 | $269,720 |
| 2023 | $7,475 | $264,840 | $66,480 | $198,360 |
| 2022 | $4,880 | $212,800 | $52,160 | $160,640 |
| 2021 | $5,758 | $206,600 | $50,640 | $155,960 |
| 2020 | $5,795 | $204,160 | $50,040 | $154,120 |
| 2019 | $875 | $191,440 | $46,680 | $144,760 |
| 2018 | $5,277 | $186,960 | $45,600 | $141,360 |
| 2017 | $5,170 | $177,200 | $42,800 | $134,400 |
| 2016 | $4,821 | $177,200 | $42,800 | $134,400 |
| 2015 | $5,659 | $177,200 | $42,800 | $134,400 |
| 2014 | $4,449 | $157,880 | $38,120 | $119,760 |
Source: Public Records
Map
Nearby Homes
- 2825 Gleneagles Pointe
- 1170 Greatwood Manor
- 2120 Blackheath Trace
- 1230 Greatwood Manor
- 2485 Hamptons Passage
- 3770 Newport Bay Dr
- 6000 Greatwood Terrace
- 3020 Bent Creek Terrace
- 12595 Huntington Trace
- 2250 Blackheath Trace
- 440 Newport Heights
- 12981 Dartmore Cir
- 5370 McGinnis Ferry Rd
- 13042 Dartmore Ave
- 1065 Beacon Hill Crossing
- 12470 Concord Hall Dr
- 1050 Beacon Hill Crossing
- 5510 Vicarage Walk
- 290 Ardsley Ln
- 2900 Gleneagles Pointe
- 2920 Gleneagles Pointe
- 2915 Gleneagles Pointe
- 2915 Glen Eagles Pte
- 2890 Glen Eagles Point
- 2930 Gleneagles Pointe
- 2890 Gleneagles Pointe
- 2925 Gleneagles Pointe
- 2905 Gleneagles Pointe
- 2960 Gleneagles Pointe
- 2895 Gleneagles Pointe
- 2950 Gleneagles Pointe
- 2870 Gleneagles Pointe
- 2935 Gleneagles Pointe
- 2935 Gleneagles
- 2885 Gleneagles Pointe
- 1075 Greatwood Manor
- 1085 Greatwood Manor
- 2860 Gleneagles Pointe
- 2860 Glen Eagles Point