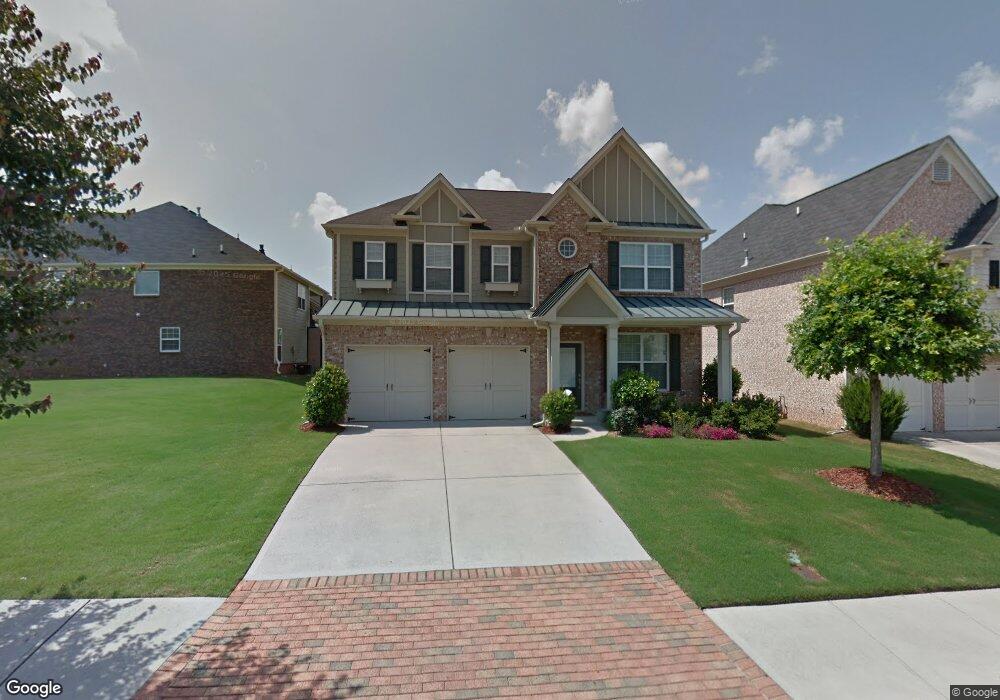
2910 Royston Dr Duluth, GA 30097
Estimated Value: $580,000 - $625,000
5
Beds
4
Baths
2,926
Sq Ft
$204/Sq Ft
Est. Value
About This Home
This home is located at 2910 Royston Dr, Duluth, GA 30097 and is currently estimated at $595,452, approximately $203 per square foot. 2910 Royston Dr is a home located in Gwinnett County with nearby schools including M. H. Mason Elementary School, Hull Middle School, and Peachtree Ridge High School.
Ownership History
Date
Name
Owned For
Owner Type
Purchase Details
Closed on
Jan 21, 2015
Sold by
Yoon Hyuk Sang
Bought by
Hyun Jong Yul and Hyun Haejoon
Current Estimated Value
Home Financials for this Owner
Home Financials are based on the most recent Mortgage that was taken out on this home.
Original Mortgage
$224,000
Outstanding Balance
$171,456
Interest Rate
3.9%
Mortgage Type
New Conventional
Estimated Equity
$423,996
Purchase Details
Closed on
Jan 26, 2011
Sold by
Francis Oral C
Bought by
Yoon Hyuk S
Home Financials for this Owner
Home Financials are based on the most recent Mortgage that was taken out on this home.
Original Mortgage
$205,535
Interest Rate
3.25%
Mortgage Type
FHA
Purchase Details
Closed on
Aug 7, 2007
Sold by
Kim Judy S
Bought by
Countrywide Home Loans Inc
Purchase Details
Closed on
Dec 21, 2005
Sold by
Hm Centex
Bought by
Francis Oral C
Home Financials for this Owner
Home Financials are based on the most recent Mortgage that was taken out on this home.
Original Mortgage
$68,700
Interest Rate
6.19%
Mortgage Type
New Conventional
Create a Home Valuation Report for This Property
The Home Valuation Report is an in-depth analysis detailing your home's value as well as a comparison with similar homes in the area
Home Values in the Area
Average Home Value in this Area
Purchase History
| Date | Buyer | Sale Price | Title Company |
|---|---|---|---|
| Hyun Jong Yul | $280,000 | -- | |
| Yoon Hyuk S | $225,000 | -- | |
| Countrywide Home Loans Inc | $293,542 | -- | |
| Francis Oral C | $343,200 | -- |
Source: Public Records
Mortgage History
| Date | Status | Borrower | Loan Amount |
|---|---|---|---|
| Open | Hyun Jong Yul | $224,000 | |
| Previous Owner | Yoon Hyuk S | $205,535 | |
| Previous Owner | Francis Oral C | $68,700 |
Source: Public Records
Tax History Compared to Growth
Tax History
| Year | Tax Paid | Tax Assessment Tax Assessment Total Assessment is a certain percentage of the fair market value that is determined by local assessors to be the total taxable value of land and additions on the property. | Land | Improvement |
|---|---|---|---|---|
| 2025 | $1,383 | $223,640 | $36,000 | $187,640 |
| 2024 | $4,974 | $199,440 | $47,600 | $151,840 |
| 2023 | $4,974 | $202,560 | $40,000 | $162,560 |
| 2022 | $4,398 | $170,640 | $34,000 | $136,640 |
| 2021 | $3,682 | $131,600 | $26,000 | $105,600 |
| 2020 | $3,715 | $131,600 | $26,000 | $105,600 |
| 2019 | $4,425 | $124,720 | $26,000 | $98,720 |
| 2018 | $3,577 | $124,720 | $26,000 | $98,720 |
| 2016 | $3,018 | $99,000 | $20,800 | $78,200 |
| 2015 | $3,704 | $92,840 | $20,000 | $72,840 |
| 2014 | -- | $88,000 | $20,000 | $68,000 |
Source: Public Records
Map
Nearby Homes
- 2571 Royston Dr
- 3515 River Summit Trail
- 3625 River Summit Trail
- 3475 Leaf Land Ct
- 3629 Rogers Bridge Rd
- 3634 Clearbrooke Way
- 3311 Dogwood Ln Unit I
- 2643 Timberbrooke Place
- 2397 Harpers Way
- 3590 North St
- 2281 Bransley Place
- 3546 Flycatcher Way
- 3653 North St
- 3264 Lockett Trace
- 3955 Longlake Dr
- 2301 Castlemaine Dr
- 4180 Cavalier Way
- 2920 Royston Dr
- 2870 Royston Dr
- 2840 Royston Dr
- 2930 Royston Dr
- 2911 Royston Dr
- 2830 Royston Dr
- 2921 Royston Dr
- 2901 Royston Dr
- 2940 Royston Dr
- 2931 Royston Dr
- 2891 Royston Dr
- 2941 Royston Dr
- 2861 Royston Dr
- 2851 Royston Dr
- 2881 Royst Drive
- 2950 Royston Dr
- 2820 Royston Dr
- 2871 Royston Dr
- 2841 Royston Dr
- 2951 Royston Dr