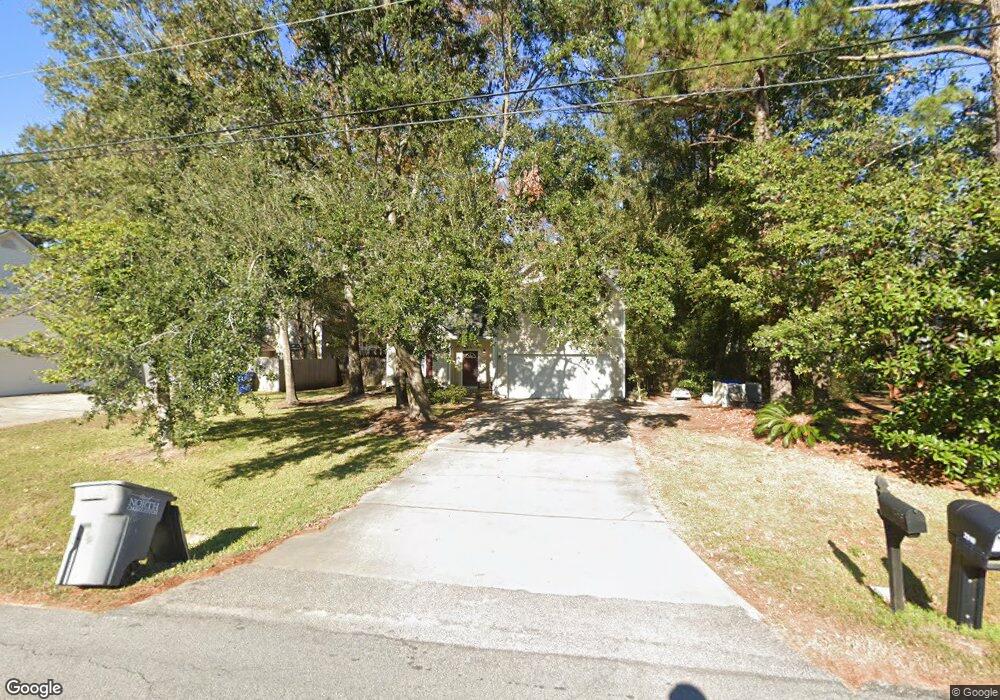
2910 Shadow Ln Unit 1 Charleston, SC 29406
Deer Park NeighborhoodEstimated Value: $391,000 - $473,000
4
Beds
4
Baths
2,383
Sq Ft
$182/Sq Ft
Est. Value
About This Home
This home is located at 2910 Shadow Ln Unit 1, Charleston, SC 29406 and is currently estimated at $433,878, approximately $182 per square foot. 2910 Shadow Ln Unit 1 is a home located in Charleston County with nearby schools including A.C. Corcoran Elementary School, Northwoods Middle, and R.B. Stall High School.
Ownership History
Date
Name
Owned For
Owner Type
Purchase Details
Closed on
May 24, 2023
Sold by
Phelps Rachel and Swearingen Laura
Bought by
Hughes Lottie and Malone Cory M
Current Estimated Value
Home Financials for this Owner
Home Financials are based on the most recent Mortgage that was taken out on this home.
Original Mortgage
$10,000
Interest Rate
6.57%
Mortgage Type
New Conventional
Purchase Details
Closed on
Jul 28, 2011
Sold by
Gajdosik Stephen and Gajdosik Tonia H
Bought by
Cline Peter F and Cline Sherry M
Home Financials for this Owner
Home Financials are based on the most recent Mortgage that was taken out on this home.
Original Mortgage
$150,000
Interest Rate
4.53%
Mortgage Type
New Conventional
Purchase Details
Closed on
Jun 20, 2005
Sold by
O S Builders Inc
Bought by
Gajdosik Stephen and Gajdosik Tonia H
Purchase Details
Closed on
Aug 26, 2002
Sold by
Vanhorn Thomas J
Bought by
O S Builders Inc
Create a Home Valuation Report for This Property
The Home Valuation Report is an in-depth analysis detailing your home's value as well as a comparison with similar homes in the area
Home Values in the Area
Average Home Value in this Area
Purchase History
| Date | Buyer | Sale Price | Title Company |
|---|---|---|---|
| Hughes Lottie | $390,000 | None Listed On Document | |
| Cline Peter F | $190,000 | -- | |
| Gajdosik Stephen | $219,000 | -- | |
| O S Builders Inc | $11,000 | -- |
Source: Public Records
Mortgage History
| Date | Status | Borrower | Loan Amount |
|---|---|---|---|
| Closed | Hughes Lottie | $10,000 | |
| Open | Hughes Lottie | $382,936 | |
| Previous Owner | Cline Peter F | $150,000 |
Source: Public Records
Tax History
| Year | Tax Paid | Tax Assessment Tax Assessment Total Assessment is a certain percentage of the fair market value that is determined by local assessors to be the total taxable value of land and additions on the property. | Land | Improvement |
|---|---|---|---|---|
| 2024 | $2,193 | $23,400 | $0 | $0 |
| 2023 | $7,027 | $15,000 | $0 | $0 |
| 2022 | $4,320 | $15,000 | $0 | $0 |
| 2021 | $4,286 | $15,000 | $0 | $0 |
| 2020 | $4,249 | $15,000 | $0 | $0 |
| 2019 | $3,066 | $10,260 | $0 | $0 |
| 2017 | $2,907 | $10,260 | $0 | $0 |
| 2016 | $2,821 | $10,260 | $0 | $0 |
| 2015 | $2,727 | $10,260 | $0 | $0 |
| 2014 | $1,095 | $0 | $0 | $0 |
| 2011 | -- | $0 | $0 | $0 |
Source: Public Records
Map
Nearby Homes
- 2972 Fernwood Dr
- 2974 Fernwood Dr
- 2976 Fernwood Dr
- 9021 Salamander Rd
- 2861 Hagerman St
- 9035 Salamander Rd
- 2977 Fernwood Dr
- 2981 Fernwood Dr
- 9033 Salamander Rd
- 9031 Salamander Rd
- 8990 Buck Run Ct
- 2969 Fernwood Dr
- 8943 Furr St
- 2971 Fernwood Dr
- 2973 Fernwood Dr
- 2819 Shadow Ln
- 8899 Salamander Rd
- 8867 Salamander Rd Unit 67
- 8867 Salamander Rd Unit 10
- 8867 Salamander Rd Unit 19
- 2910 Shadow Ln
- 9108 Timber St
- 9108 Timber St Unit 1
- 2916 Shadow Ln Unit 1
- 2900 Shadow Ln
- 9110 Timber St
- 2911 Shadow Ln
- 2915 Shadow Ln
- 9021 Ethel Rd
- 8757 Shadow Ln
- 8775 Shadow Ln
- 8745 Shadow Ln
- 8807 Shadow Ln
- 9105 Timber St
- 2907 Shadow Ln
- 9101 Timber St
- 9048 Timber St
- 0 Ethel Rd Unit 18033326
- 2922 Shadow Ln
- 2922 Shadow Ln
Your Personal Tour Guide
Ask me questions while you tour the home.