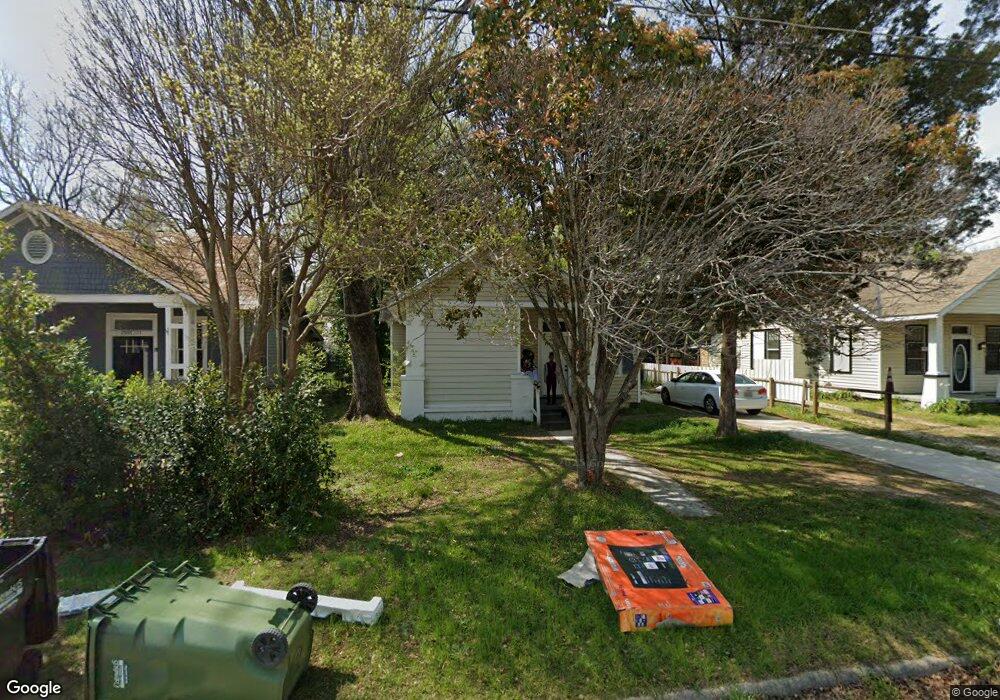
2911 13th Ave Columbus, GA 31904
Estimated Value: $71,500 - $122,000
3
Beds
3
Baths
1,122
Sq Ft
$88/Sq Ft
Est. Value
About This Home
This home is located at 2911 13th Ave, Columbus, GA 31904 and is currently estimated at $99,125, approximately $88 per square foot. 2911 13th Ave is a home located in Muscogee County with nearby schools including Johnson Elementary School, Arnold Middle School, and Jordan Vocational High School.
Ownership History
Date
Name
Owned For
Owner Type
Purchase Details
Closed on
Feb 21, 2020
Sold by
Rosehill Rental Properties Llc
Bought by
Pathway Properties Of West Ga Llc
Current Estimated Value
Purchase Details
Closed on
Nov 28, 2006
Sold by
Lr Partners Llc
Bought by
Rp Property Management Inc
Home Financials for this Owner
Home Financials are based on the most recent Mortgage that was taken out on this home.
Original Mortgage
$48,908
Interest Rate
6.62%
Mortgage Type
Commercial
Create a Home Valuation Report for This Property
The Home Valuation Report is an in-depth analysis detailing your home's value as well as a comparison with similar homes in the area
Home Values in the Area
Average Home Value in this Area
Purchase History
| Date | Buyer | Sale Price | Title Company |
|---|---|---|---|
| Pathway Properties Of West Ga Llc | $162,500 | -- | |
| Rp Property Management Inc | $397,400 | None Available |
Source: Public Records
Mortgage History
| Date | Status | Borrower | Loan Amount |
|---|---|---|---|
| Previous Owner | Rp Property Management Inc | $48,908 |
Source: Public Records
Tax History Compared to Growth
Tax History
| Year | Tax Paid | Tax Assessment Tax Assessment Total Assessment is a certain percentage of the fair market value that is determined by local assessors to be the total taxable value of land and additions on the property. | Land | Improvement |
|---|---|---|---|---|
| 2025 | $979 | $25,000 | $6,260 | $18,740 |
| 2024 | $979 | $25,000 | $6,260 | $18,740 |
| 2023 | $728 | $27,168 | $6,260 | $20,908 |
| 2022 | $755 | $18,488 | $6,260 | $12,228 |
| 2021 | $596 | $14,596 | $6,260 | $8,336 |
| 2020 | $507 | $14,596 | $3,132 | $11,464 |
| 2019 | $598 | $14,596 | $3,132 | $11,464 |
| 2018 | $601 | $17,268 | $6,260 | $11,008 |
| 2017 | $710 | $17,268 | $6,260 | $11,008 |
| 2016 | $576 | $13,955 | $2,448 | $11,507 |
| 2015 | $576 | $13,955 | $2,448 | $11,507 |
| 2014 | $473 | $20,077 | $2,448 | $17,629 |
| 2013 | -- | $20,077 | $2,448 | $17,629 |
Source: Public Records
Map
Nearby Homes