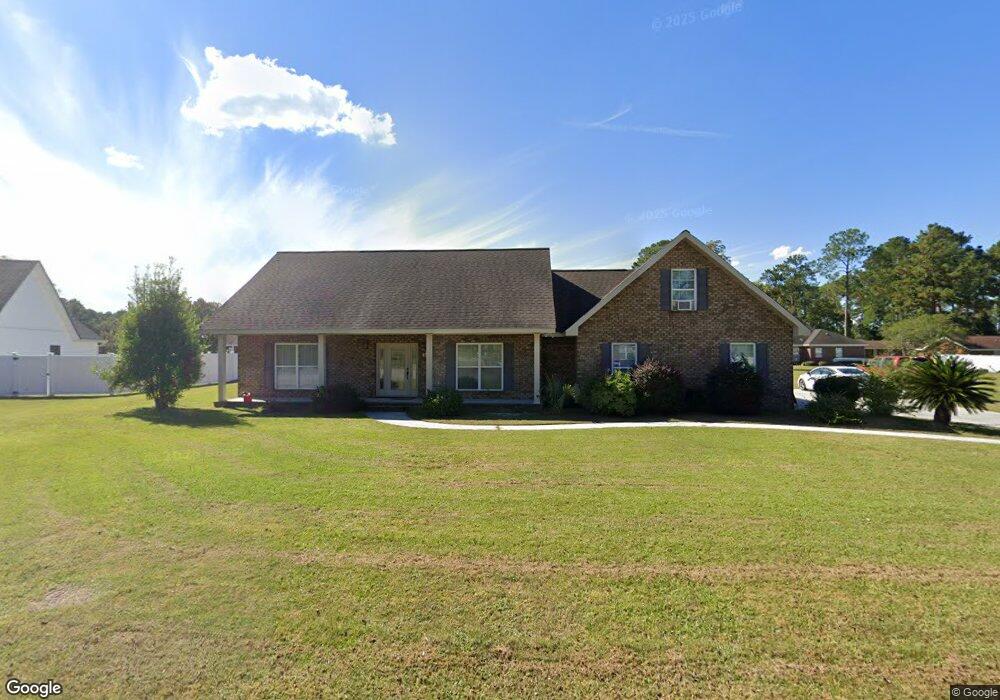
2911 Ash Dr Waycross, GA 31501
Estimated Value: $304,000 - $370,000
3
Beds
2
Baths
2,267
Sq Ft
$143/Sq Ft
Est. Value
About This Home
This home is located at 2911 Ash Dr, Waycross, GA 31501 and is currently estimated at $325,043, approximately $143 per square foot. 2911 Ash Dr is a home located in Ware County with nearby schools including Wacona Elementary School, Ware County Middle School, and Ware County High School.
Ownership History
Date
Name
Owned For
Owner Type
Purchase Details
Closed on
Dec 23, 2016
Sold by
Locklear Melvin and Locklear Sarah S
Bought by
Parham William Ward
Current Estimated Value
Home Financials for this Owner
Home Financials are based on the most recent Mortgage that was taken out on this home.
Original Mortgage
$211,498
Outstanding Balance
$169,341
Interest Rate
3.25%
Mortgage Type
FHA
Estimated Equity
$155,702
Purchase Details
Closed on
Jun 30, 2015
Sold by
Locklear Melvin
Bought by
Locklear Mevlin and Locklear Sarah S
Home Financials for this Owner
Home Financials are based on the most recent Mortgage that was taken out on this home.
Original Mortgage
$200,305
Interest Rate
4.12%
Mortgage Type
FHA
Purchase Details
Closed on
Jun 26, 2015
Sold by
Hinely Christopher S
Bought by
Locklear Melvin
Home Financials for this Owner
Home Financials are based on the most recent Mortgage that was taken out on this home.
Original Mortgage
$200,305
Interest Rate
4.12%
Mortgage Type
FHA
Create a Home Valuation Report for This Property
The Home Valuation Report is an in-depth analysis detailing your home's value as well as a comparison with similar homes in the area
Home Values in the Area
Average Home Value in this Area
Purchase History
| Date | Buyer | Sale Price | Title Company |
|---|---|---|---|
| Parham William Ward | $215,400 | -- | |
| Locklear Mevlin | -- | -- | |
| Locklear Melvin | $204,000 | -- |
Source: Public Records
Mortgage History
| Date | Status | Borrower | Loan Amount |
|---|---|---|---|
| Open | Parham William Ward | $211,498 | |
| Previous Owner | Locklear Mevlin | $200,305 | |
| Previous Owner | Locklear Melvin | $200,305 |
Source: Public Records
Tax History Compared to Growth
Tax History
| Year | Tax Paid | Tax Assessment Tax Assessment Total Assessment is a certain percentage of the fair market value that is determined by local assessors to be the total taxable value of land and additions on the property. | Land | Improvement |
|---|---|---|---|---|
| 2024 | $2,938 | $112,428 | $6,300 | $106,128 |
| 2023 | $2,893 | $93,036 | $7,057 | $85,979 |
| 2022 | $2,686 | $93,036 | $7,057 | $85,979 |
| 2021 | $2,323 | $74,078 | $7,057 | $67,021 |
| 2020 | $2,280 | $71,908 | $7,057 | $64,851 |
| 2019 | $2,039 | $63,068 | $7,057 | $56,011 |
| 2018 | $1,986 | $60,849 | $7,057 | $53,792 |
| 2017 | $2,459 | $55,525 | $7,057 | $48,468 |
| 2016 | $2,459 | $75,407 | $7,057 | $68,350 |
| 2015 | $2,482 | $75,406 | $7,057 | $68,350 |
| 2014 | -- | $75,406 | $7,057 | $68,350 |
| 2013 | -- | $75,406 | $7,056 | $68,349 |
Source: Public Records
Map
Nearby Homes