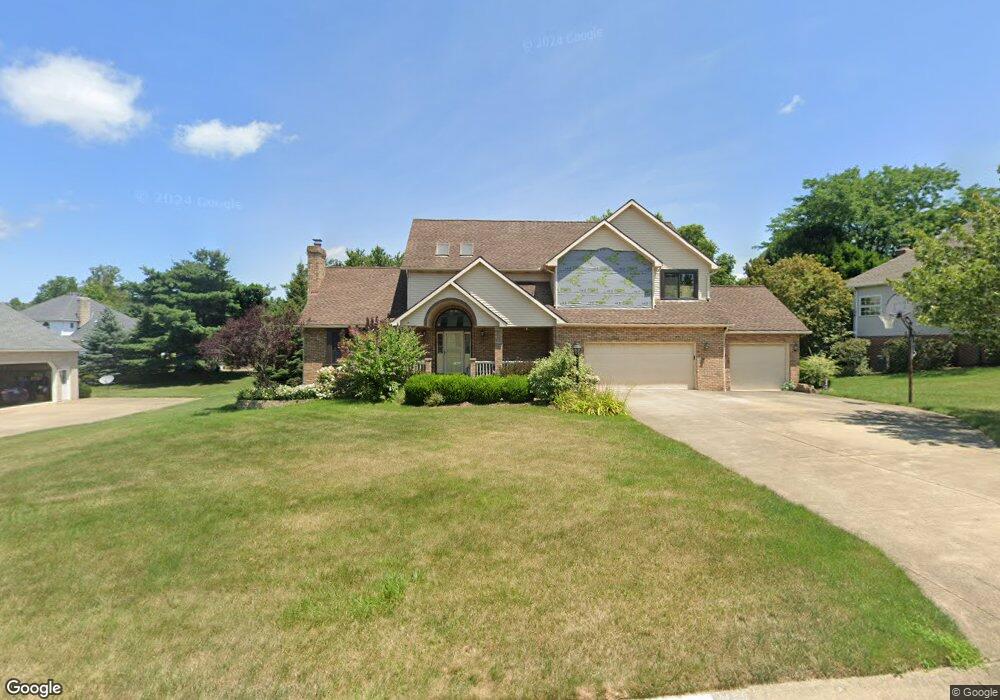
2911 Chalford Cir NW North Canton, OH 44720
Estimated Value: $451,309 - $507,000
4
Beds
3
Baths
2,908
Sq Ft
$168/Sq Ft
Est. Value
About This Home
This home is located at 2911 Chalford Cir NW, North Canton, OH 44720 and is currently estimated at $488,827, approximately $168 per square foot. 2911 Chalford Cir NW is a home located in Stark County with nearby schools including North Canton Middle School, Hoover High School, and St Paul School.
Ownership History
Date
Name
Owned For
Owner Type
Purchase Details
Closed on
Feb 16, 2007
Sold by
Wise James P and Wise Christina E
Bought by
Daily David T and Daily Jody E
Current Estimated Value
Home Financials for this Owner
Home Financials are based on the most recent Mortgage that was taken out on this home.
Original Mortgage
$265,000
Outstanding Balance
$159,692
Interest Rate
6.27%
Mortgage Type
Purchase Money Mortgage
Estimated Equity
$329,135
Purchase Details
Closed on
Mar 14, 1996
Sold by
Alexander John P
Bought by
Wise James P and Wise Christina
Home Financials for this Owner
Home Financials are based on the most recent Mortgage that was taken out on this home.
Original Mortgage
$208,800
Interest Rate
6.5%
Mortgage Type
New Conventional
Purchase Details
Closed on
Apr 5, 1995
Sold by
Quail Hill Ptns
Bought by
Alexander John P
Purchase Details
Closed on
Mar 4, 1994
Purchase Details
Closed on
Nov 19, 1993
Create a Home Valuation Report for This Property
The Home Valuation Report is an in-depth analysis detailing your home's value as well as a comparison with similar homes in the area
Home Values in the Area
Average Home Value in this Area
Purchase History
| Date | Buyer | Sale Price | Title Company |
|---|---|---|---|
| Daily David T | $265,000 | Quest Title Agency Inc | |
| Wise James P | $232,000 | -- | |
| Alexander John P | $44,000 | -- | |
| -- | $124,800 | -- | |
| -- | -- | -- |
Source: Public Records
Mortgage History
| Date | Status | Borrower | Loan Amount |
|---|---|---|---|
| Open | Daily David T | $265,000 | |
| Closed | Wise James P | $208,800 |
Source: Public Records
Tax History Compared to Growth
Tax History
| Year | Tax Paid | Tax Assessment Tax Assessment Total Assessment is a certain percentage of the fair market value that is determined by local assessors to be the total taxable value of land and additions on the property. | Land | Improvement |
|---|---|---|---|---|
| 2025 | -- | $140,530 | $30,660 | $109,870 |
| 2024 | -- | $140,530 | $30,660 | $109,870 |
| 2023 | $6,546 | $122,860 | $27,410 | $95,450 |
| 2022 | $6,279 | $122,860 | $27,410 | $95,450 |
| 2021 | $6,460 | $122,860 | $27,410 | $95,450 |
| 2020 | $6,077 | $105,530 | $23,630 | $81,900 |
| 2019 | $5,691 | $105,530 | $23,630 | $81,900 |
| 2018 | $5,894 | $105,530 | $23,630 | $81,900 |
| 2017 | $5,331 | $100,490 | $21,840 | $78,650 |
| 2016 | $5,351 | $100,490 | $21,840 | $78,650 |
| 2015 | $5,372 | $100,490 | $21,840 | $78,650 |
| 2014 | $994 | $88,380 | $19,180 | $69,200 |
| 2013 | $2,499 | $88,380 | $19,180 | $69,200 |
Source: Public Records
Map
Nearby Homes
- 9364 Pheasant Valley Ave NW
- 3047 Chalford Cir NW Unit 46B
- 2709 Country Squire St NW
- 9520-9570 Cleveland Ave NW
- 9276 Shipton Cir NW
- 9120 Bletchley Ave NW
- 9760 Summerset Ave NW
- 3322 Perrydale St NW
- 10044 Cleveland Ave NW
- 2870 Brouse St NW
- 2884 Sutherland Cir NW
- 9133 Wellspring Ave NW
- 3564 Shepherd St NW
- 2840 Barclay Cir NW
- 10380 Sudbury Cir NW
- 3048 Wright Rd NW
- 10531 Newbury Ave NW
- 3278 Sumser St NW Unit 2
- 8510 Deacon Ave NW
- 3620 Cain St NW
- 2923 Chalford Cir NW
- 2852 Shillingford Cir NW
- 2870 Shillingford Cir NW
- 2832 Shillingford Cir NW
- 2914 Chalford Cir NW
- 9449 Pheasant Valley Ave NW
- 2884 Shillingford Cir NW
- 3096 Shillington
- 9474 Huntshire Ave NW Unit 39
- 9462 Pheasant Valley Ave NW
- 9460 Huntshire Ave NW Unit 38
- 2794 Shillingford Cir NW
- 2933 Chalford Cir NW
- 9433 Pheasant Valley Ave NW
- 2831 Shillingford Cir NW
- 9450 Pheasant Valley Ave NW
- 2886 Shillingford Cir NW
- 2851 Shillingford Cir NW
- 9475 Huntshire Ave NW Unit 32
- 2869 Shillingford Cir NW