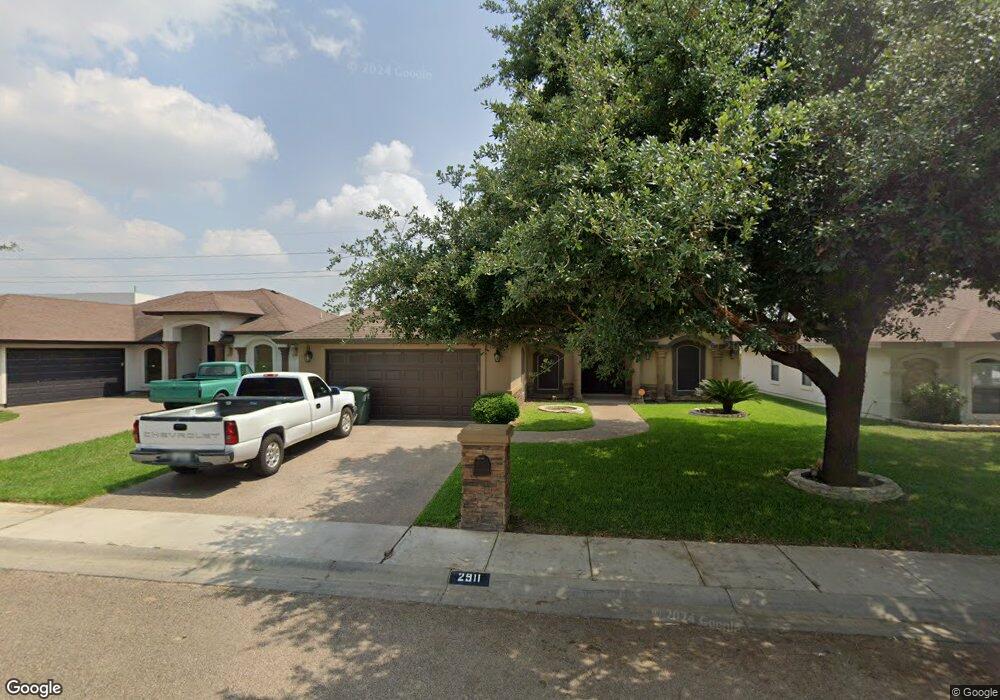
2911 Fishers Hill Loop Laredo, TX 78045
Estimated Value: $277,314 - $310,000
--
Bed
--
Bath
1,581
Sq Ft
$189/Sq Ft
Est. Value
About This Home
This home is located at 2911 Fishers Hill Loop, Laredo, TX 78045 and is currently estimated at $299,079, approximately $189 per square foot. 2911 Fishers Hill Loop is a home located in Webb County with nearby schools including Charles Borchers Elementary School, Trautmann Middle School, and John B. Alexander High School.
Ownership History
Date
Name
Owned For
Owner Type
Purchase Details
Closed on
Jul 28, 2015
Sold by
Sikes Thomas
Bought by
Medellin Servando
Current Estimated Value
Home Financials for this Owner
Home Financials are based on the most recent Mortgage that was taken out on this home.
Original Mortgage
$181,450
Outstanding Balance
$142,514
Interest Rate
4.07%
Mortgage Type
New Conventional
Estimated Equity
$156,565
Purchase Details
Closed on
Apr 15, 2015
Sold by
Bank Of America Na
Bought by
Sikes Thomas
Purchase Details
Closed on
Mar 10, 2015
Sold by
Narvaez Angel and Narvaez Jessica Ingrid
Bought by
Bank Of America Na
Purchase Details
Closed on
Feb 5, 2015
Sold by
Lopez Jessica I
Bought by
Narvaez Angel O
Purchase Details
Closed on
Mar 9, 2007
Sold by
Kgd Builders Inc
Bought by
Narvaez Angel and Narvaez Jessica
Home Financials for this Owner
Home Financials are based on the most recent Mortgage that was taken out on this home.
Original Mortgage
$193,930
Interest Rate
6.32%
Mortgage Type
Purchase Money Mortgage
Create a Home Valuation Report for This Property
The Home Valuation Report is an in-depth analysis detailing your home's value as well as a comparison with similar homes in the area
Home Values in the Area
Average Home Value in this Area
Purchase History
| Date | Buyer | Sale Price | Title Company |
|---|---|---|---|
| Medellin Servando | -- | None Available | |
| Sikes Thomas | -- | None Available | |
| Bank Of America Na | $110,200 | None Available | |
| Narvaez Angel O | $176,691 | None Available | |
| Narvaez Angel | -- | Border Title Group |
Source: Public Records
Mortgage History
| Date | Status | Borrower | Loan Amount |
|---|---|---|---|
| Open | Medellin Servando | $181,450 | |
| Previous Owner | Narvaez Angel | $193,930 |
Source: Public Records
Tax History Compared to Growth
Tax History
| Year | Tax Paid | Tax Assessment Tax Assessment Total Assessment is a certain percentage of the fair market value that is determined by local assessors to be the total taxable value of land and additions on the property. | Land | Improvement |
|---|---|---|---|---|
| 2025 | $1,289 | $278,083 | $86,160 | $191,923 |
| 2024 | $1,289 | $254,016 | -- | -- |
| 2023 | $4,583 | $230,924 | -- | -- |
| 2022 | $4,766 | $209,931 | $68,220 | $141,711 |
| 2021 | $4,997 | $194,409 | $51,792 | $142,617 |
| 2020 | $4,821 | $187,350 | $51,780 | $135,570 |
| 2019 | $4,957 | $188,860 | $51,780 | $137,080 |
| 2018 | $5,174 | $194,500 | $48,000 | $146,500 |
| 2017 | $5,068 | $193,470 | $48,000 | $145,470 |
| 2016 | $4,618 | $176,290 | $36,240 | $140,050 |
| 2015 | -- | $168,690 | $32,460 | $136,230 |
| 2014 | -- | $164,220 | $30,530 | $133,690 |
Source: Public Records
Map
Nearby Homes
- 2925 Piedmont St
- 8707 Plantation Dr E
- 8799 Wyndum Terrace Trail
- 2953 Mehlhorn Loop
- 3120 Conde Dr
- 1107 Harlan St
- 2719 Braids Dr
- 3127 Conde Dr
- 8703 Plantation Dr E
- 4002 Sun Valley Dr
- 11202 Granados St
- 1913 Orange Blossom Loop
- 11308 Granados St
- 3204 Quintero St
- 1820 Arctic Ct
- 11201 Pedrosa St
- 3118 Sun Dance Loop
- 10619 Kirby Dr
- 3004 Crest Oak Cir
- 3816 Winrock Dr
- 2909 Fishers Hill Loop
- 2913 Fishers Hill Loop
- 2912 Piedmont
- 2907 Fishers Hill Loop
- 2915 Fishers Hill Loop
- 2910 Piedmont
- 2914 Piedmont
- 8701 Calvery Ct
- 2922 Fishers Hill Loop
- 2917 Fisher's Hill Loop
- 2905 Fishers Hill Loop
- 8702 Calvery Ct
- 8709 Calvery Ct
- 2924 Fishers Hill Loop
- 2903 Fisher's Hill Loop
- 2903 Fishers Hill Loop
- 2916 Piedmont
- 8710 Calvery Ct
- 2919 Fisher's Hill Loop
- 2926 Fishers Hill Loop