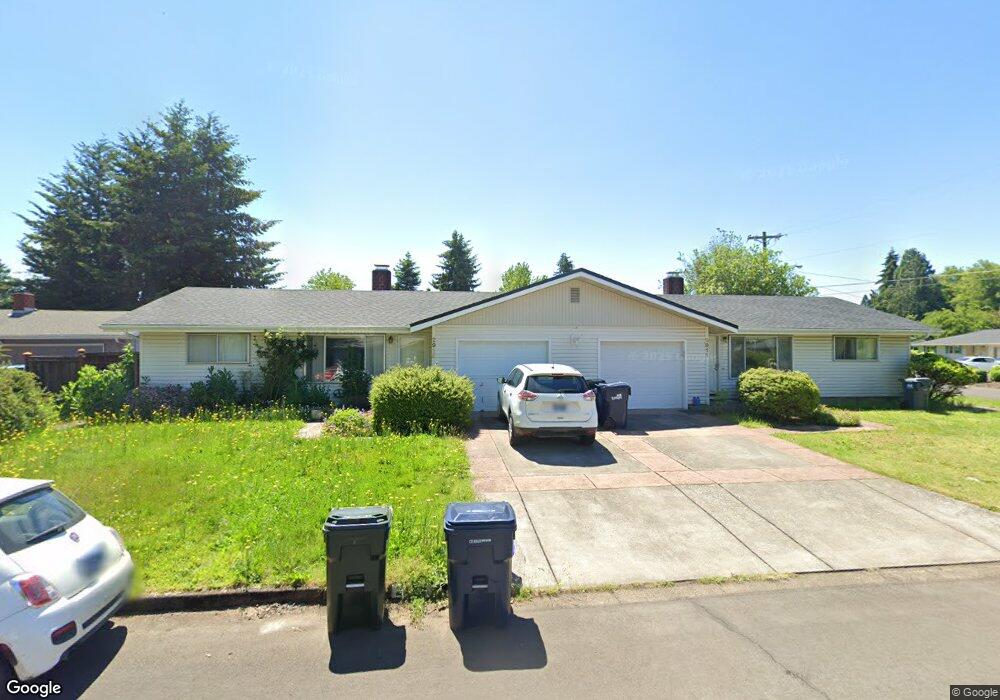
2911 Maranta St Eugene, OR 97404
Santa Clara NeighborhoodEstimated Value: $431,276 - $484,000
4
Beds
2
Baths
1,512
Sq Ft
$303/Sq Ft
Est. Value
About This Home
This home is located at 2911 Maranta St, Eugene, OR 97404 and is currently estimated at $458,319, approximately $303 per square foot. 2911 Maranta St is a home located in Lane County with nearby schools including Spring Creek Elementary School, Madison Middle School, and North Eugene High School.
Ownership History
Date
Name
Owned For
Owner Type
Purchase Details
Closed on
Aug 16, 2010
Sold by
Gemmell Gertrude C
Bought by
Spaulding Cheri E
Current Estimated Value
Purchase Details
Closed on
Oct 2, 2008
Sold by
Gemmell Robert Joseph
Bought by
Gemmell Gertrude C and The Gertrude C Gemmell Revocable Living
Purchase Details
Closed on
Sep 29, 2008
Sold by
Gemmell Suzette Juanita
Bought by
Gemmell Gertrude C and Gertrude C Gemmell Revocable Living Tr
Purchase Details
Closed on
Sep 26, 2008
Sold by
Gemmell Dale Martin
Bought by
Gemmell Gertrude C and Gertrude C Gemmell Revocable Living Tr
Purchase Details
Closed on
Sep 25, 2008
Sold by
Gemmell Gertrude
Bought by
Gemmell Gertrude C and Gertrude C Gemmell Revocable Living Tr
Purchase Details
Closed on
Oct 17, 2007
Sold by
Gemmell Gertrude
Bought by
Gemmell Gertrude and Gemmell Robert Joseph
Create a Home Valuation Report for This Property
The Home Valuation Report is an in-depth analysis detailing your home's value as well as a comparison with similar homes in the area
Home Values in the Area
Average Home Value in this Area
Purchase History
| Date | Buyer | Sale Price | Title Company |
|---|---|---|---|
| Spaulding Cheri E | $230,000 | Western Title & Escrow | |
| Gemmell Gertrude C | -- | None Available | |
| Gemmell Gertrude C | -- | None Available | |
| Gemmell Gertrude C | -- | None Available | |
| Gemmell Gertrude C | -- | None Available | |
| Gemmell Gertrude C | -- | None Available | |
| Gemmell Gertrude | -- | Pacific Northwest Title Of L |
Source: Public Records
Tax History
| Year | Tax Paid | Tax Assessment Tax Assessment Total Assessment is a certain percentage of the fair market value that is determined by local assessors to be the total taxable value of land and additions on the property. | Land | Improvement |
|---|---|---|---|---|
| 2025 | $3,680 | $268,786 | -- | -- |
| 2024 | $3,656 | $260,958 | -- | -- |
| 2023 | $3,656 | $253,358 | $0 | $0 |
| 2022 | $3,437 | $245,979 | $0 | $0 |
| 2021 | $3,090 | $238,815 | $0 | $0 |
| 2020 | $2,892 | $231,860 | $0 | $0 |
| 2019 | $2,723 | $225,107 | $0 | $0 |
| 2018 | $2,412 | $212,185 | $0 | $0 |
| 2017 | $2,299 | $212,185 | $0 | $0 |
| 2016 | $2,237 | $206,005 | $0 | $0 |
| 2015 | $2,219 | $200,005 | $0 | $0 |
| 2014 | $2,184 | $194,180 | $0 | $0 |
Source: Public Records
Map
Nearby Homes
- 835 Bobolink Ave
- 2937 Stark St
- 2740 Stark St
- 2987 Dry Creek Rd
- 2721 La Darrah St
- 2931 Shelby Way
- 2488 Northampton
- 2610 Crowther Dr
- 1284 Alderbrook Ln
- 2563 York St
- 2580 Crowther Dr
- 2484 Crowther Dr
- 2418 Kalmia St
- 3365 Goose Cross Ln
- 349 Irving Rd
- 374 Blackfoot Ave
- 3470 Cabernet Ln
- 200 Irving Rd
- 1133 Irvington Dr
- 3884 Shenstone Dr
- 2895 Maranta St
- 2959 Maranta St
- 2957 Maranta St
- 2931 Maranta St
- 2912 Maranta St
- 2881 Maranta St
- 2890 Maranta St
- 2860 Maesner St
- 2938 Maranta St
- 2947 Maranta St
- 2939 Maranta St
- 2932 Maesner St
- 2852 Maesner St
- 2963 Maranta St
- 2948 Maesner St
- 2878 Maranta St
- 2863 Maranta St
- 2844 Maesner St
- 2960 Maranta St
- 2964 Maesner St
Your Personal Tour Guide
Ask me questions while you tour the home.