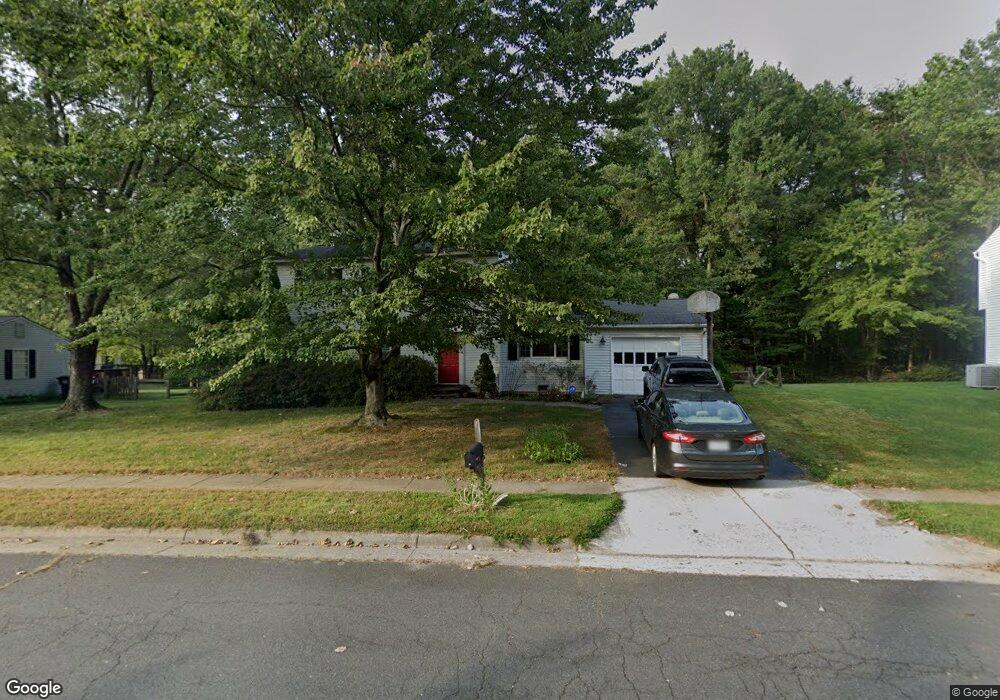
2911 Timber Wood Way Herndon, VA 20171
Oak Hill NeighborhoodEstimated Value: $831,000 - $919,000
4
Beds
3
Baths
2,123
Sq Ft
$412/Sq Ft
Est. Value
About This Home
This home is located at 2911 Timber Wood Way, Herndon, VA 20171 and is currently estimated at $873,679, approximately $411 per square foot. 2911 Timber Wood Way is a home located in Fairfax County with nearby schools including Crossfield Elementary, Rachel Carson Middle School, and Oakton High.
Ownership History
Date
Name
Owned For
Owner Type
Purchase Details
Closed on
Jul 30, 2020
Sold by
Hilleary Robert B
Bought by
Koenig Jill
Current Estimated Value
Home Financials for this Owner
Home Financials are based on the most recent Mortgage that was taken out on this home.
Original Mortgage
$510,000
Outstanding Balance
$453,241
Interest Rate
3.1%
Mortgage Type
New Conventional
Estimated Equity
$420,438
Purchase Details
Closed on
Mar 28, 2014
Sold by
Hilleary Robert B
Bought by
Hilleary Robert B
Home Financials for this Owner
Home Financials are based on the most recent Mortgage that was taken out on this home.
Original Mortgage
$307,520
Interest Rate
4.27%
Mortgage Type
New Conventional
Purchase Details
Closed on
Aug 8, 2001
Sold by
Mukherjee Misti
Bought by
Hilleary Tanya F
Home Financials for this Owner
Home Financials are based on the most recent Mortgage that was taken out on this home.
Original Mortgage
$260,000
Interest Rate
7.1%
Create a Home Valuation Report for This Property
The Home Valuation Report is an in-depth analysis detailing your home's value as well as a comparison with similar homes in the area
Home Values in the Area
Average Home Value in this Area
Purchase History
| Date | Buyer | Sale Price | Title Company |
|---|---|---|---|
| Koenig Jill | $637,500 | Eagle Title Llc | |
| Hilleary Robert B | -- | -- | |
| Hilleary Tanya F | $325,000 | -- |
Source: Public Records
Mortgage History
| Date | Status | Borrower | Loan Amount |
|---|---|---|---|
| Open | Koenig Jill | $510,000 | |
| Previous Owner | Hilleary Robert B | $307,520 | |
| Previous Owner | Hilleary Tanya F | $260,000 |
Source: Public Records
Tax History Compared to Growth
Tax History
| Year | Tax Paid | Tax Assessment Tax Assessment Total Assessment is a certain percentage of the fair market value that is determined by local assessors to be the total taxable value of land and additions on the property. | Land | Improvement |
|---|---|---|---|---|
| 2025 | $8,356 | $731,250 | $270,000 | $461,250 |
| 2024 | $8,356 | $721,250 | $260,000 | $461,250 |
| 2023 | $8,239 | $730,120 | $260,000 | $470,120 |
| 2022 | $7,762 | $678,790 | $260,000 | $418,790 |
| 2021 | $7,446 | $634,470 | $250,000 | $384,470 |
| 2020 | $6,708 | $566,760 | $230,000 | $336,760 |
| 2019 | $6,447 | $544,730 | $230,000 | $314,730 |
| 2018 | $5,788 | $503,300 | $210,000 | $293,300 |
| 2017 | $5,817 | $501,010 | $210,000 | $291,010 |
| 2016 | $6,072 | $524,110 | $210,000 | $314,110 |
| 2015 | $5,508 | $493,560 | $200,000 | $293,560 |
| 2014 | $5,376 | $482,800 | $195,000 | $287,800 |
Source: Public Records
Map
Nearby Homes
- 12527 Chasbarb Terrace
- 2700 Reign St
- 2657 Chiswell Place
- 2725 Robaleed Way
- 12436 Wendell Holmes Rd
- 2736 Calkins Rd
- 13019 Bankfoot Ct
- 12732 Bradwell Rd
- 12703 Carlsbad Ct
- 3189 Pond Mist Way
- 3142 Searsmont Place
- 12704 Autumn Crest Dr
- 13009 Farthingale Dr
- 12205 Thoroughbred Rd
- 2653 Fanieul Hall Ct
- 2484 Freetown Dr
- 2969 Mother Well Ct
- 12305 Westwood Hills Dr
- 12817 Framingham Ct
- 2904 Rock Manor Ct
- 2909 Timber Wood Way
- 2913 Timber Wood Way
- 12619 Glenbrooke Woods Dr
- 12617 Glenbrooke Woods Dr
- 2907 Timber Wood Way
- 2915 Timber Wood Way
- 12621 Glenbrooke Woods Dr
- 2904 Timber Wood Way
- 12615 Glenbrooke Woods Dr
- 2797 Crystal Wood Ct
- 2905 Timber Wood Way
- 12613 Glenbrooke Woods Dr
- 2917 Timber Wood Way
- 12630 Glenbrooke Woods Dr
- 2902 Timber Wood Way
- 2796 Crystal Wood Ct
- 12611 Glenbrooke Woods Dr
- 2903 Timber Wood Way
- 12626 Glenbrooke Woods Dr
- 2919 Timber Wood Way