Estimated Value: $405,095 - $427,000
3
Beds
2
Baths
1,740
Sq Ft
$239/Sq Ft
Est. Value
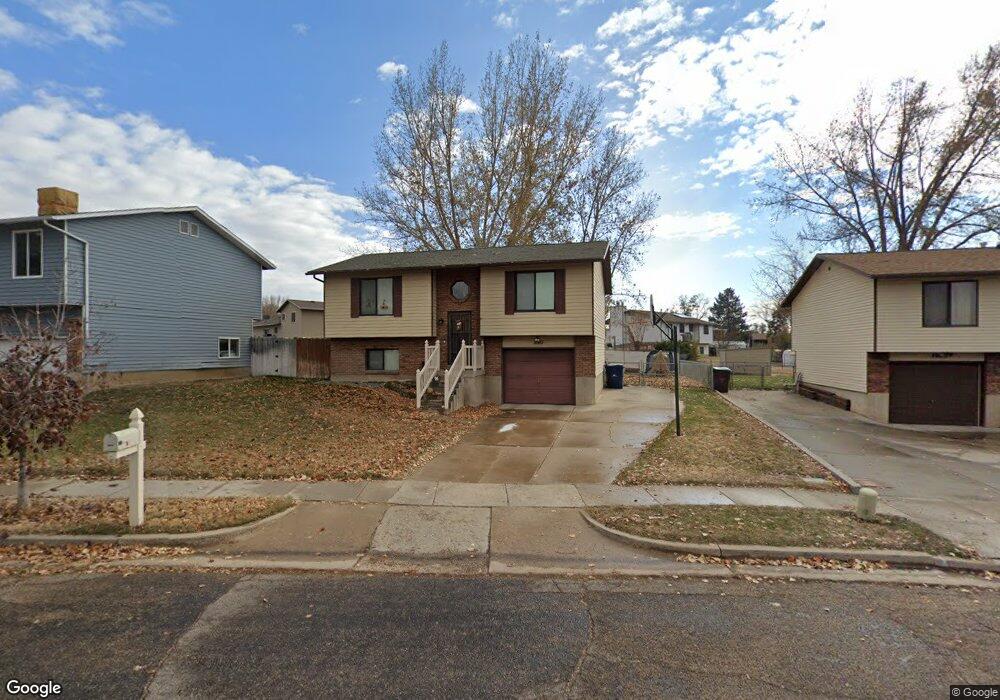
About This Home
This home is located at 2911 W 5825 S, Roy, UT 84067 and is currently estimated at $416,274, approximately $239 per square foot. 2911 W 5825 S is a home located in Weber County with nearby schools including Roy Elementary School, Roy Junior High School, and Roy High School.
Ownership History
Date
Name
Owned For
Owner Type
Purchase Details
Closed on
Dec 1, 2023
Sold by
Bingham Antoinette and Bingham Drew
Bought by
Bingham Drew and Bingham Laney Dawn
Current Estimated Value
Home Financials for this Owner
Home Financials are based on the most recent Mortgage that was taken out on this home.
Original Mortgage
$30,000
Outstanding Balance
$29,514
Interest Rate
7.63%
Mortgage Type
Credit Line Revolving
Estimated Equity
$386,760
Purchase Details
Closed on
Apr 1, 2011
Sold by
Simpson Derek B and Simpson Jennie
Bought by
Dahle Travis and Swanger Lauren
Home Financials for this Owner
Home Financials are based on the most recent Mortgage that was taken out on this home.
Original Mortgage
$128,653
Interest Rate
4.99%
Mortgage Type
FHA
Purchase Details
Closed on
Jun 3, 2009
Sold by
Simpson Derek and Simpson Jennie
Bought by
Simpson Derek B and Simpson Jennie
Home Financials for this Owner
Home Financials are based on the most recent Mortgage that was taken out on this home.
Original Mortgage
$113,400
Interest Rate
4.78%
Mortgage Type
New Conventional
Purchase Details
Closed on
Aug 16, 2007
Sold by
Nelson Jessie Sue
Bought by
Simpson Derek and Larsen Jennie
Home Financials for this Owner
Home Financials are based on the most recent Mortgage that was taken out on this home.
Original Mortgage
$109,000
Interest Rate
6.62%
Mortgage Type
Purchase Money Mortgage
Purchase Details
Closed on
Jul 27, 2007
Sold by
Nelson David Scott
Bought by
Nelson Jessie Sue
Home Financials for this Owner
Home Financials are based on the most recent Mortgage that was taken out on this home.
Original Mortgage
$109,000
Interest Rate
6.62%
Mortgage Type
Purchase Money Mortgage
Purchase Details
Closed on
Sep 26, 2001
Sold by
Nelson Jessie Sue and Nelson David Scott
Bought by
Nelson Jessie Sue
Home Financials for this Owner
Home Financials are based on the most recent Mortgage that was taken out on this home.
Original Mortgage
$95,500
Interest Rate
6.9%
Purchase Details
Closed on
Oct 8, 1999
Sold by
Mortensen Jessie Sue and Nelson Jessie Sue
Bought by
Nelson David Scott and Nelson Jessie Sue
Create a Home Valuation Report for This Property
The Home Valuation Report is an in-depth analysis detailing your home's value as well as a comparison with similar homes in the area
Home Values in the Area
Average Home Value in this Area
Purchase History
| Date | Buyer | Sale Price | Title Company |
|---|---|---|---|
| Bingham Drew | -- | None Listed On Document | |
| Dahle Travis | -- | First American Layton | |
| Simpson Derek B | -- | Bonneville Superior Title Co | |
| Simpson Derek | -- | Bonneville Superior Title Co | |
| Nelson Jessie Sue | -- | Bonneville Superior Title Co | |
| Nelson Jessie Sue | -- | Meridian Title | |
| Nelson David Scott | -- | Inwest Title |
Source: Public Records
Mortgage History
| Date | Status | Borrower | Loan Amount |
|---|---|---|---|
| Open | Bingham Drew | $30,000 | |
| Previous Owner | Dahle Travis | $128,653 | |
| Previous Owner | Simpson Derek B | $113,400 | |
| Previous Owner | Simpson Derek | $109,000 | |
| Previous Owner | Nelson Jessie Sue | $95,500 |
Source: Public Records
Tax History Compared to Growth
Tax History
| Year | Tax Paid | Tax Assessment Tax Assessment Total Assessment is a certain percentage of the fair market value that is determined by local assessors to be the total taxable value of land and additions on the property. | Land | Improvement |
|---|---|---|---|---|
| 2025 | $2,346 | $367,095 | $116,169 | $250,926 |
| 2024 | $2,291 | $198,549 | $63,906 | $134,643 |
| 2023 | $2,419 | $212,300 | $64,894 | $147,406 |
| 2022 | $2,313 | $207,901 | $53,730 | $154,171 |
| 2021 | $1,992 | $295,000 | $63,339 | $231,661 |
| 2020 | $1,808 | $245,000 | $63,339 | $181,661 |
| 2019 | $1,743 | $222,000 | $38,660 | $183,340 |
| 2018 | $1,618 | $193,000 | $35,740 | $157,260 |
| 2017 | $1,575 | $176,299 | $34,800 | $141,499 |
| 2016 | $1,456 | $87,078 | $18,898 | $68,180 |
| 2015 | $1,263 | $76,265 | $18,898 | $57,367 |
| 2014 | $1,274 | $76,265 | $18,898 | $57,367 |
Source: Public Records
Map
Nearby Homes