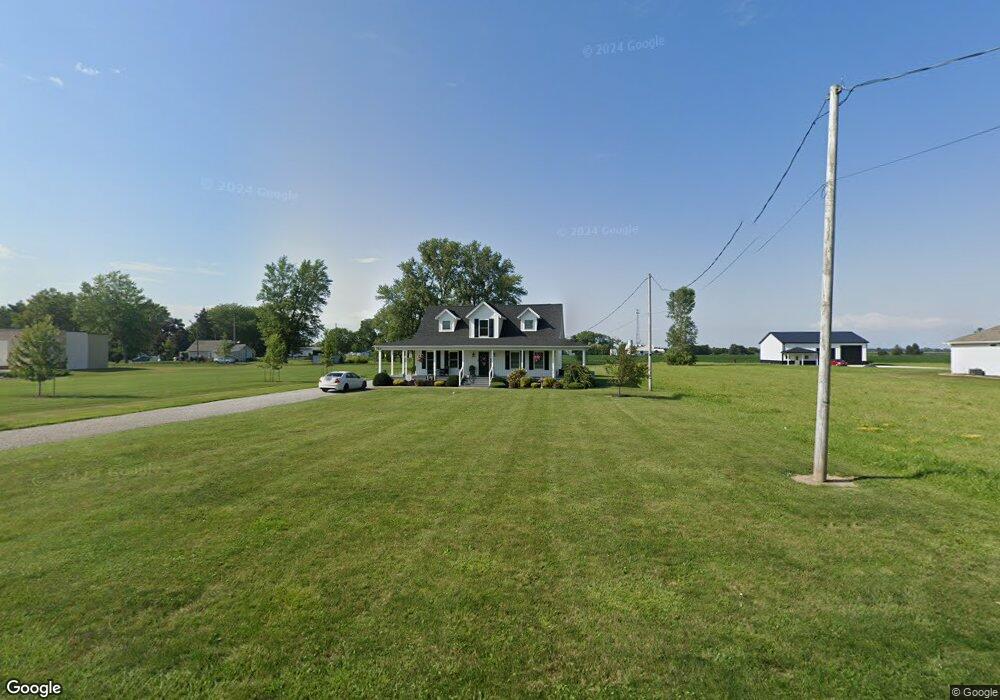
2911 W Bogart Rd Sandusky, OH 44870
Estimated Value: $243,000 - $328,438
3
Beds
3
Baths
2,200
Sq Ft
$128/Sq Ft
Est. Value
About This Home
This home is located at 2911 W Bogart Rd, Sandusky, OH 44870 and is currently estimated at $281,610, approximately $128 per square foot. 2911 W Bogart Rd is a home located in Erie County with nearby schools including Furry Elementary School, Meadowlawn Elementary School, and Briar Middle School.
Ownership History
Date
Name
Owned For
Owner Type
Purchase Details
Closed on
Mar 19, 2009
Sold by
Jones Lisa G and Jones Terry J
Bought by
Salmons William T
Current Estimated Value
Home Financials for this Owner
Home Financials are based on the most recent Mortgage that was taken out on this home.
Original Mortgage
$99,906
Outstanding Balance
$63,762
Interest Rate
5.2%
Mortgage Type
FHA
Estimated Equity
$217,848
Purchase Details
Closed on
Apr 23, 2005
Sold by
Jones Terry J and Jones Lisa G
Bought by
Jones Lisa G
Purchase Details
Closed on
Jan 6, 1997
Sold by
Rodriguez Nancy
Bought by
Jones Terry J and Jones Lisa G
Home Financials for this Owner
Home Financials are based on the most recent Mortgage that was taken out on this home.
Original Mortgage
$44,500
Interest Rate
7.6%
Mortgage Type
New Conventional
Create a Home Valuation Report for This Property
The Home Valuation Report is an in-depth analysis detailing your home's value as well as a comparison with similar homes in the area
Home Values in the Area
Average Home Value in this Area
Purchase History
| Date | Buyer | Sale Price | Title Company |
|---|---|---|---|
| Salmons William T | $101,750 | City Title Company | |
| Jones Lisa G | -- | None Available | |
| Jones Terry J | $33,500 | -- |
Source: Public Records
Mortgage History
| Date | Status | Borrower | Loan Amount |
|---|---|---|---|
| Open | Salmons William T | $99,906 | |
| Previous Owner | Jones Terry J | $44,500 |
Source: Public Records
Tax History Compared to Growth
Tax History
| Year | Tax Paid | Tax Assessment Tax Assessment Total Assessment is a certain percentage of the fair market value that is determined by local assessors to be the total taxable value of land and additions on the property. | Land | Improvement |
|---|---|---|---|---|
| 2024 | $3,757 | $82,218 | $25,410 | $56,808 |
| 2023 | $3,757 | $65,555 | $21,000 | $44,555 |
| 2022 | $3,673 | $65,558 | $21,000 | $44,558 |
| 2021 | $3,669 | $65,560 | $21,000 | $44,560 |
| 2020 | $3,178 | $57,290 | $21,000 | $36,290 |
| 2019 | $3,270 | $57,290 | $21,000 | $36,290 |
| 2018 | $3,272 | $57,290 | $21,000 | $36,290 |
| 2017 | $3,318 | $56,510 | $16,220 | $40,290 |
| 2016 | $2,897 | $56,510 | $16,220 | $40,290 |
| 2015 | $2,844 | $56,510 | $16,220 | $40,290 |
| 2014 | $2,875 | $56,510 | $16,220 | $40,290 |
| 2013 | $2,680 | $56,510 | $16,220 | $40,290 |
Source: Public Records
Map
Nearby Homes
- 735 Cedar Point
- 0 Quarry Lakes Dr Unit 20205329
- 0 Quarry Lakes Dr Unit 20205328
- 2001 Wade Blvd
- 3321 Hayes Ave
- 1305 S Lake Wilmer Dr Unit 208A
- 3216 Hayes Ave
- 0 Lakeside Unit 20253835
- 736 Kelley Ln
- 730 Kelley Ln
- 1101 W Bogart Rd
- 1006 W Bogart Rd
- 7114 Hayes Ave
- 3601 Bardshar Rd
- 817 W Bogart Rd
- 3818 Donair Dr
- 414 Indiana Ave
- 301 Schiller Ave
- 404 Cedar Brook Ln
- 3005 Bardshar Rd
- 5014 Hayes Ave
- 2908 W Bogart Rd
- 2906 W Bogart Rd
- 2910 W Bogart Rd
- 5002 Hayes Ave
- 2904 W Bogart Rd
- 2912 W Bogart Rd
- 2819 W Bogart Rd
- 2902 W Bogart Rd
- 5007 Hayes Ave
- 2813 W Bogart Rd
- 2820 W Bogart Rd
- 5005 Hayes Ave
- 4917 Hayes Ave
- 4908 Hayes Ave
- 2816 W Bogart Rd
- 2810 W Bogart Rd
- 2805 W Bogart Rd
- 5112 Hayes Ave
- 2806 W Bogart Rd