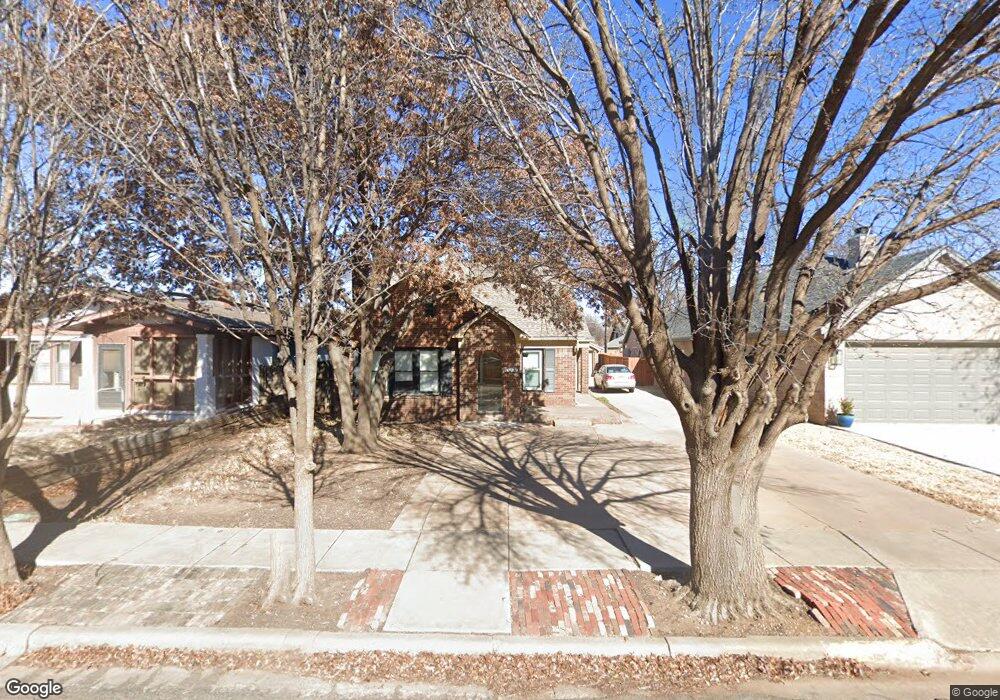
2912 21st St Lubbock, TX 79410
Tech Terrace (UNIT) NeighborhoodEstimated Value: $323,000 - $383,000
3
Beds
2
Baths
2,386
Sq Ft
$150/Sq Ft
Est. Value
About This Home
This home is located at 2912 21st St, Lubbock, TX 79410 and is currently estimated at $358,185, approximately $150 per square foot. 2912 21st St is a home located in Lubbock County with nearby schools including Wilson Elementary School, Hutchinson Middle School, and Lubbock High School.
Ownership History
Date
Name
Owned For
Owner Type
Purchase Details
Closed on
May 12, 2017
Sold by
Ricker Philip D and Ricker Anna
Bought by
Wagner Barndon and Wagner Elizabeth
Current Estimated Value
Home Financials for this Owner
Home Financials are based on the most recent Mortgage that was taken out on this home.
Original Mortgage
$207,000
Outstanding Balance
$172,335
Interest Rate
4.14%
Mortgage Type
New Conventional
Estimated Equity
$185,850
Purchase Details
Closed on
Feb 28, 2011
Sold by
J & C Carpenter Family L P
Bought by
Ricker Philip D and Ricker Anna
Home Financials for this Owner
Home Financials are based on the most recent Mortgage that was taken out on this home.
Original Mortgage
$163,000
Interest Rate
4.73%
Mortgage Type
Future Advance Clause Open End Mortgage
Purchase Details
Closed on
Jun 28, 2005
Sold by
Szyliowicz Dara M
Bought by
Wagner Brandon and Wagner Elizabeth
Create a Home Valuation Report for This Property
The Home Valuation Report is an in-depth analysis detailing your home's value as well as a comparison with similar homes in the area
Home Values in the Area
Average Home Value in this Area
Purchase History
| Date | Buyer | Sale Price | Title Company |
|---|---|---|---|
| Wagner Barndon | -- | Western Title Co | |
| Ricker Philip D | -- | Lubbock Abstract & Title Co | |
| Wagner Brandon | -- | -- |
Source: Public Records
Mortgage History
| Date | Status | Borrower | Loan Amount |
|---|---|---|---|
| Open | Wagner Barndon | $207,000 | |
| Previous Owner | Ricker Philip D | $163,000 |
Source: Public Records
Tax History Compared to Growth
Tax History
| Year | Tax Paid | Tax Assessment Tax Assessment Total Assessment is a certain percentage of the fair market value that is determined by local assessors to be the total taxable value of land and additions on the property. | Land | Improvement |
|---|---|---|---|---|
| 2025 | $5,423 | $319,236 | $45,350 | $273,886 |
| 2024 | $5,423 | $348,672 | $45,350 | $303,322 |
| 2023 | $5,940 | $319,547 | $24,000 | $295,547 |
| 2022 | $5,881 | $290,497 | $24,000 | $271,059 |
| 2021 | $5,656 | $264,088 | $24,000 | $240,088 |
| 2020 | $5,743 | $264,088 | $24,000 | $240,088 |
| 2019 | $5,586 | $248,846 | $24,000 | $224,846 |
| 2018 | $5,594 | $248,846 | $24,000 | $224,846 |
| 2017 | $5,143 | $228,520 | $24,000 | $204,520 |
| 2016 | $3,939 | $175,003 | $24,000 | $151,003 |
| 2015 | $3,802 | $166,693 | $24,000 | $142,693 |
| 2014 | $3,802 | $171,000 | $10,000 | $161,000 |
Source: Public Records
Map
Nearby Homes