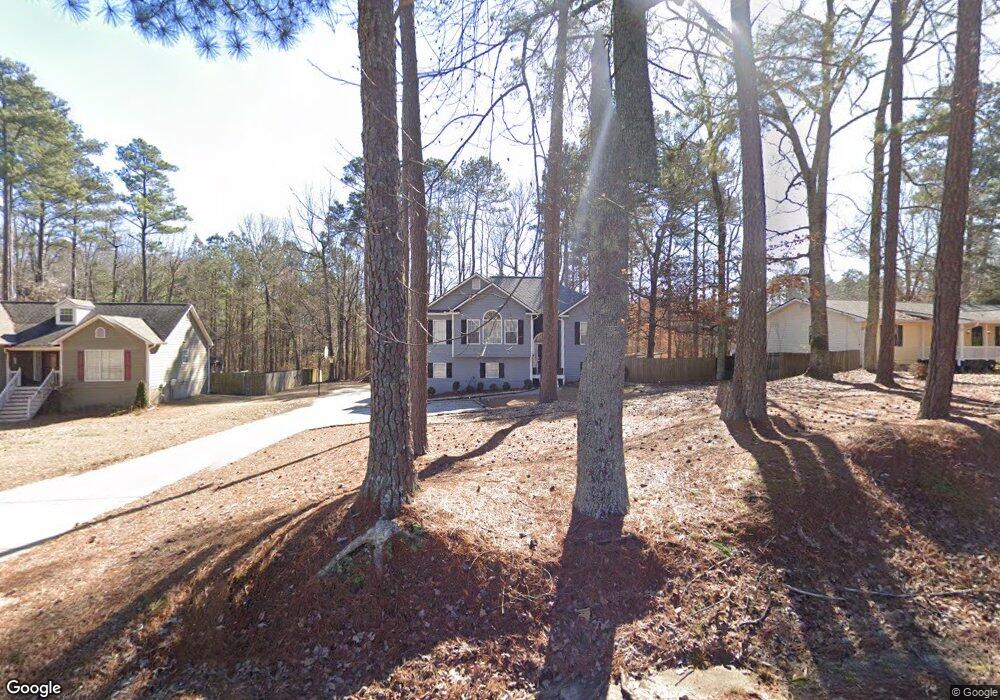
2912 Bomar Rd Unit 1 Douglasville, GA 30135
Lithia Springs NeighborhoodEstimated Value: $261,000 - $311,000
3
Beds
2
Baths
1,676
Sq Ft
$169/Sq Ft
Est. Value
About This Home
This home is located at 2912 Bomar Rd Unit 1, Douglasville, GA 30135 and is currently estimated at $283,496, approximately $169 per square foot. 2912 Bomar Rd Unit 1 is a home located in Douglas County with nearby schools including Mt. Carmel Elementary School, Chestnut Log Middle School, and New Manchester High School.
Ownership History
Date
Name
Owned For
Owner Type
Purchase Details
Closed on
Feb 28, 2006
Sold by
Johnson Stephen L and Johnson Phyllis R H
Bought by
Mann Gerald
Current Estimated Value
Home Financials for this Owner
Home Financials are based on the most recent Mortgage that was taken out on this home.
Original Mortgage
$134,900
Outstanding Balance
$98,526
Interest Rate
11.81%
Mortgage Type
New Conventional
Estimated Equity
$184,970
Purchase Details
Closed on
Jun 8, 2004
Sold by
Johnson Stephen L
Bought by
Johnson Stephen L and Johnson Phyllis R
Home Financials for this Owner
Home Financials are based on the most recent Mortgage that was taken out on this home.
Original Mortgage
$100,700
Interest Rate
7.75%
Mortgage Type
New Conventional
Purchase Details
Closed on
Aug 23, 1996
Sold by
Southernmagnolia Homes
Bought by
Chance Michael Mary
Create a Home Valuation Report for This Property
The Home Valuation Report is an in-depth analysis detailing your home's value as well as a comparison with similar homes in the area
Home Values in the Area
Average Home Value in this Area
Purchase History
| Date | Buyer | Sale Price | Title Company |
|---|---|---|---|
| Mann Gerald | $142,000 | -- | |
| Johnson Stephen L | -- | -- | |
| Johnson Stephen L | $118,500 | -- | |
| Chance Michael Mary | $117,900 | -- |
Source: Public Records
Mortgage History
| Date | Status | Borrower | Loan Amount |
|---|---|---|---|
| Open | Mann Gerald | $134,900 | |
| Previous Owner | Johnson Stephen L | $100,700 | |
| Closed | Chance Michael Mary | $0 |
Source: Public Records
Tax History Compared to Growth
Tax History
| Year | Tax Paid | Tax Assessment Tax Assessment Total Assessment is a certain percentage of the fair market value that is determined by local assessors to be the total taxable value of land and additions on the property. | Land | Improvement |
|---|---|---|---|---|
| 2024 | $2,627 | $96,880 | $26,000 | $70,880 |
| 2023 | $2,627 | $96,880 | $26,000 | $70,880 |
| 2022 | $2,714 | $96,880 | $26,000 | $70,880 |
| 2021 | $2,010 | $63,160 | $11,040 | $52,120 |
| 2020 | $2,036 | $63,160 | $11,040 | $52,120 |
| 2019 | $1,848 | $61,120 | $11,040 | $50,080 |
| 2018 | $1,569 | $51,880 | $9,600 | $42,280 |
| 2017 | $1,424 | $46,400 | $9,600 | $36,800 |
| 2016 | $1,403 | $45,080 | $9,600 | $35,480 |
| 2015 | $1,393 | $43,920 | $9,600 | $34,320 |
| 2014 | $1,298 | $40,320 | $9,600 | $30,720 |
| 2013 | -- | $40,240 | $9,600 | $30,640 |
Source: Public Records
Map
Nearby Homes
- 2930 Bomar Rd
- 2910 Bomar Rd
- 3580 Newberry Ln
- 3600 Newberry Ln
- 3560 Newberry Ln
- 2931 Bomar Rd
- 3540 Newberry Ln Unit 2
- 2946 Bomar Rd
- 2941 Bomar Rd
- 3595 Newberry Ln
- 3575 Newberry Ln
- 2883 Bomar Rd
- 3555 Newberry Ln Unit 2
- 3520 Newberry Ln Unit 2
- 2945 Bomar Rd
- 2940 Leah Ln Unit 2940
- 2956 Bomar Rd
- 3585 Newberry Ln
- 3475 Newberry Ln Unit 2
- 3500 Newberry Ln