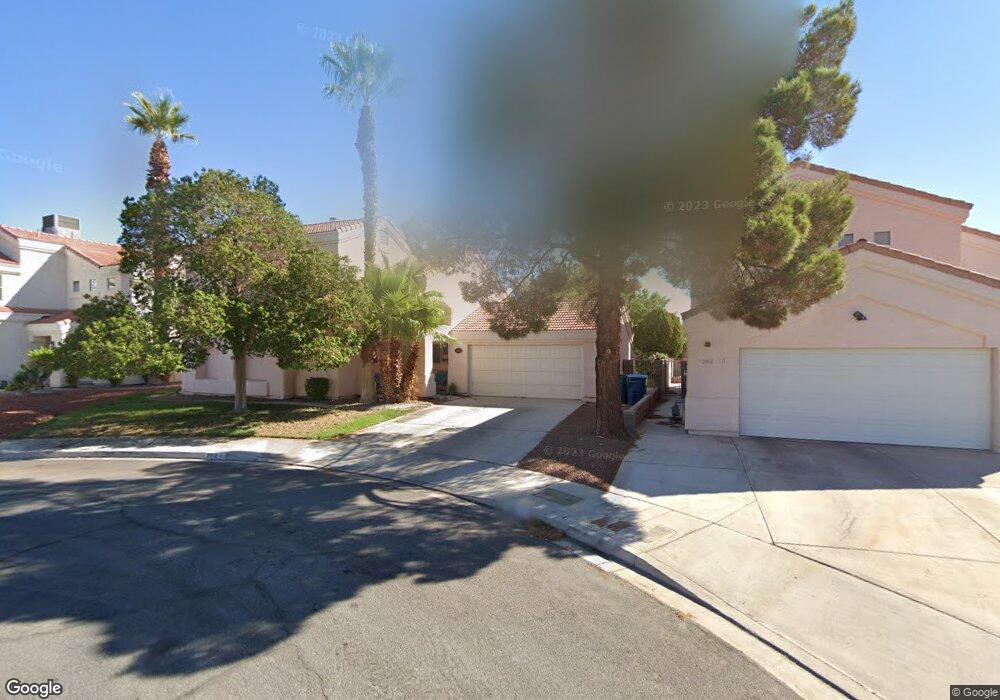
2912 Du Barry Manor Ln Las Vegas, NV 89108
Michael Way NeighborhoodEstimated Value: $360,000 - $397,000
3
Beds
3
Baths
1,472
Sq Ft
$258/Sq Ft
Est. Value
About This Home
This home is located at 2912 Du Barry Manor Ln, Las Vegas, NV 89108 and is currently estimated at $380,015, approximately $258 per square foot. 2912 Du Barry Manor Ln is a home located in Clark County with nearby schools including Berkeley L. Bunker Elementary School, Irwin & Susan Molasky Junior High School, and Cimarron Memorial High School.
Ownership History
Date
Name
Owned For
Owner Type
Purchase Details
Closed on
Oct 12, 2010
Sold by
Andrews Holly
Bought by
Nevo Roni
Current Estimated Value
Purchase Details
Closed on
Oct 11, 2005
Sold by
Jungers Lynn and Jungers Maryann
Bought by
Andrews Holly
Home Financials for this Owner
Home Financials are based on the most recent Mortgage that was taken out on this home.
Original Mortgage
$216,000
Interest Rate
5.63%
Mortgage Type
Fannie Mae Freddie Mac
Purchase Details
Closed on
Mar 17, 2005
Sold by
Herrera Socorro I
Bought by
Jungers Lynn and Jungers Maryann
Purchase Details
Closed on
Mar 12, 1998
Sold by
Dorsett Stanton H and Dorsett Elsie A
Bought by
Herrera Richard and Herrera Soccorro I
Home Financials for this Owner
Home Financials are based on the most recent Mortgage that was taken out on this home.
Original Mortgage
$117,025
Interest Rate
7.18%
Create a Home Valuation Report for This Property
The Home Valuation Report is an in-depth analysis detailing your home's value as well as a comparison with similar homes in the area
Home Values in the Area
Average Home Value in this Area
Purchase History
| Date | Buyer | Sale Price | Title Company |
|---|---|---|---|
| Nevo Roni | $95,000 | Lawyers Title Of Nevada Vil | |
| Andrews Holly | $273,900 | Land Title Of Nevada | |
| Jungers Lynn | $210,000 | Land Title Of Nevada | |
| Herrera Richard | $120,000 | Stewart Title |
Source: Public Records
Mortgage History
| Date | Status | Borrower | Loan Amount |
|---|---|---|---|
| Previous Owner | Andrews Holly | $216,000 | |
| Previous Owner | Herrera Richard | $117,025 |
Source: Public Records
Tax History Compared to Growth
Tax History
| Year | Tax Paid | Tax Assessment Tax Assessment Total Assessment is a certain percentage of the fair market value that is determined by local assessors to be the total taxable value of land and additions on the property. | Land | Improvement |
|---|---|---|---|---|
| 2025 | $1,561 | $68,214 | $26,250 | $41,964 |
| 2024 | $1,446 | $68,214 | $26,250 | $41,964 |
| 2023 | $1,446 | $66,967 | $26,600 | $40,367 |
| 2022 | $1,339 | $58,876 | $21,700 | $37,176 |
| 2021 | $1,240 | $55,960 | $20,300 | $35,660 |
| 2020 | $1,149 | $55,187 | $19,600 | $35,587 |
| 2019 | $1,077 | $52,139 | $16,800 | $35,339 |
| 2018 | $1,027 | $47,363 | $13,300 | $34,063 |
| 2017 | $1,549 | $47,248 | $12,600 | $34,648 |
| 2016 | $963 | $46,148 | $10,850 | $35,298 |
| 2015 | $960 | $40,270 | $7,000 | $33,270 |
| 2014 | $930 | $27,522 | $5,600 | $21,922 |
Source: Public Records
Map
Nearby Homes
- 6673 Silver Penny Ave
- 6612 Gentle Winds Ct
- 6632 Light Breeze Dr
- 6612 Old Newbury Ave
- 6544 Old Oxford Ave
- 2801 N Rainbow Blvd Unit 103
- 2801 N Rainbow Blvd Unit 273
- 2801 N Rainbow Blvd Unit 252
- 2801 N Rainbow Blvd Unit 112
- 6632 Coastal Breeze Ct
- 3100 Garehime St
- 6536 Castor Tree Way
- 2700 N Rainbow Blvd Unit 1105
- 2700 N Rainbow Blvd Unit 1137
- 2764 Trotwood Ln
- 2912 Drury St
- 6428 Yarmouth Dr
- 6561 Avon Ct
- 6705 Shallow Creek Ct
- 6325 Barkstone Ave
- 2908 Du Barry Manor Ln
- 2916 Du Barry Manor Ln
- 2917 Old Majestic St
- 2917 Old Majestic St
- 2913 Old Majestic St
- 2904 Du Barry Manor Ln
- 2921 Old Majestic St
- 2909 Old Majestic St
- 6657 Silver Penny Ave
- 6665 Silver Penny Ave
- 2913 Du Barry Manor Ln
- 2905 Old Majestic St
- 2909 Du Barry Manor Ln
- 6649 Silver Penny Ave
- 6669 Silver Penny Ave
- 2900 Du Barry Manor Ln
- 2905 Du Barry Manor Ln
- 2901 Old Majestic St
- 2901 Du Barry Manor Ln
- 2912 Old Majestic St