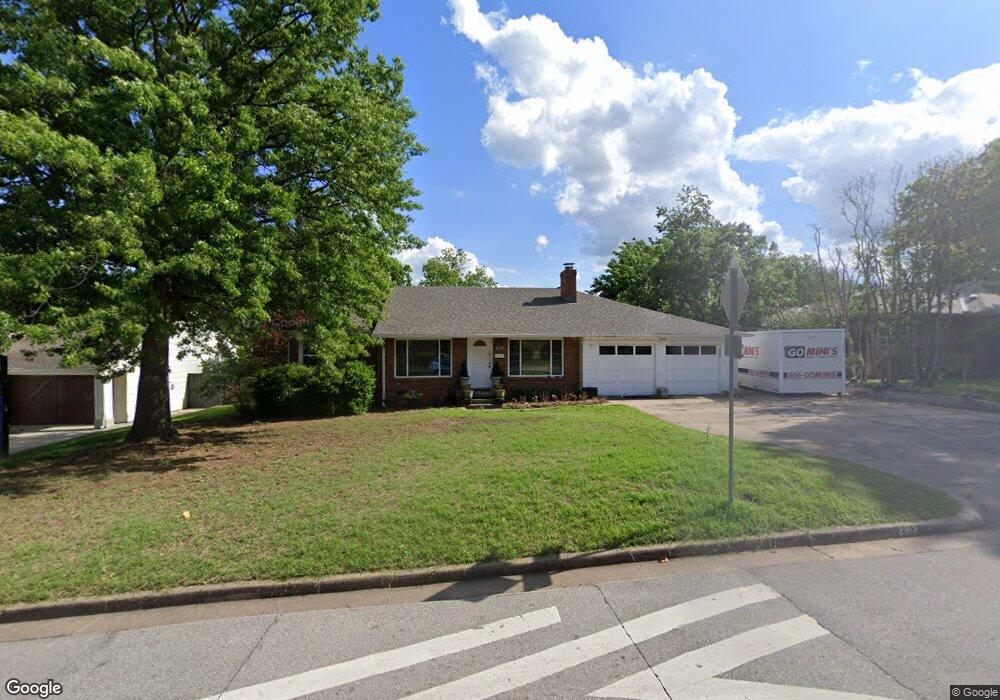
2912 E 26th St Tulsa, OK 74114
Midtown NeighborhoodEstimated Value: $410,000 - $515,000
3
Beds
2
Baths
1,918
Sq Ft
$231/Sq Ft
Est. Value
About This Home
This home is located at 2912 E 26th St, Tulsa, OK 74114 and is currently estimated at $443,099, approximately $231 per square foot. 2912 E 26th St is a home located in Tulsa County with nearby schools including Patrick Henry Elementary School, Edison Preparatory School, and Thomas Edison Preparatory High School.
Ownership History
Date
Name
Owned For
Owner Type
Purchase Details
Closed on
Jun 26, 2009
Sold by
Okada Properties Llc
Bought by
Williams Gregory P
Current Estimated Value
Home Financials for this Owner
Home Financials are based on the most recent Mortgage that was taken out on this home.
Original Mortgage
$185,600
Outstanding Balance
$116,634
Interest Rate
4.83%
Mortgage Type
New Conventional
Estimated Equity
$326,465
Purchase Details
Closed on
Dec 14, 2007
Sold by
Rideout Kevin W and Rideout Carol D
Bought by
Okada Robert D and Okada Carolyn R
Home Financials for this Owner
Home Financials are based on the most recent Mortgage that was taken out on this home.
Original Mortgage
$157,500
Interest Rate
6.26%
Mortgage Type
Unknown
Purchase Details
Closed on
Dec 1, 1996
Purchase Details
Closed on
Aug 1, 1993
Create a Home Valuation Report for This Property
The Home Valuation Report is an in-depth analysis detailing your home's value as well as a comparison with similar homes in the area
Home Values in the Area
Average Home Value in this Area
Purchase History
| Date | Buyer | Sale Price | Title Company |
|---|---|---|---|
| Williams Gregory P | $232,000 | Scott Title & Escrow Co Inc | |
| Okada Robert D | $210,000 | None Available | |
| -- | $96,000 | -- | |
| -- | $86,000 | -- |
Source: Public Records
Mortgage History
| Date | Status | Borrower | Loan Amount |
|---|---|---|---|
| Open | Williams Gregory P | $185,600 | |
| Previous Owner | Okada Robert D | $157,500 |
Source: Public Records
Tax History
| Year | Tax Paid | Tax Assessment Tax Assessment Total Assessment is a certain percentage of the fair market value that is determined by local assessors to be the total taxable value of land and additions on the property. | Land | Improvement |
|---|---|---|---|---|
| 2025 | $4,328 | $32,297 | $6,264 | $26,033 |
| 2024 | $3,856 | $31,328 | $7,839 | $23,489 |
| 2023 | $3,856 | $31,386 | $8,917 | $22,469 |
| 2022 | $3,929 | $29,472 | $8,459 | $21,013 |
| 2021 | $3,775 | $28,584 | $8,204 | $20,380 |
| 2020 | $3,611 | $27,723 | $7,957 | $19,766 |
| 2019 | $3,684 | $26,887 | $7,717 | $19,170 |
| 2018 | $3,581 | $26,074 | $7,484 | $18,590 |
| 2017 | $3,466 | $26,285 | $7,544 | $18,741 |
| 2016 | $3,292 | $25,520 | $7,733 | $17,787 |
| 2015 | $3,298 | $25,520 | $7,733 | $17,787 |
| 2014 | $3,267 | $25,520 | $7,733 | $17,787 |
Source: Public Records
Map
Nearby Homes
- 2547 S College Ave
- 2549 S Evanston Ave
- 2515 S Florence Ave Unit 3
- 3116 E 26th St
- 2340 S College Ave
- 2328 S Delaware Ct
- 2358 S Delaware Ct
- 2631 S Florence Dr
- 3185 E 26th St
- 2315 S Delaware Place
- 2920 E 27th Place
- 2760 S Gary Dr
- 2241 S Florence Ave
- 1251 E 28th St
- 2325 S Columbia Place
- 2522 S Columbia Ave
- 2643 E 26th St
- 2728 E 22nd Place
- 2811 E 22nd St
- 2720 E 22nd St
- 2928 E 26th St
- 2601 S Evanston Ave
- 2911 E 26th Place
- 2909 E 26th Place
- 2917 E 26th Place
- 2915 E 26th St
- 2917 E 26th St
- 2934 E 26th St
- 2927 E 26th Place
- 2610 S Evanston Ave
- 2621 E 26th Place
- 3106 E 26th St
- 2117 E 26th St
- 2541 S Evanston Ave
- 2538 S College Ave
- 2935 E 26th Place
- 2940 E 26th St
- 2914 E 26th Place
- 2906 E 26th Place
- 2535 S Evanston Ave
Your Personal Tour Guide
Ask me questions while you tour the home.