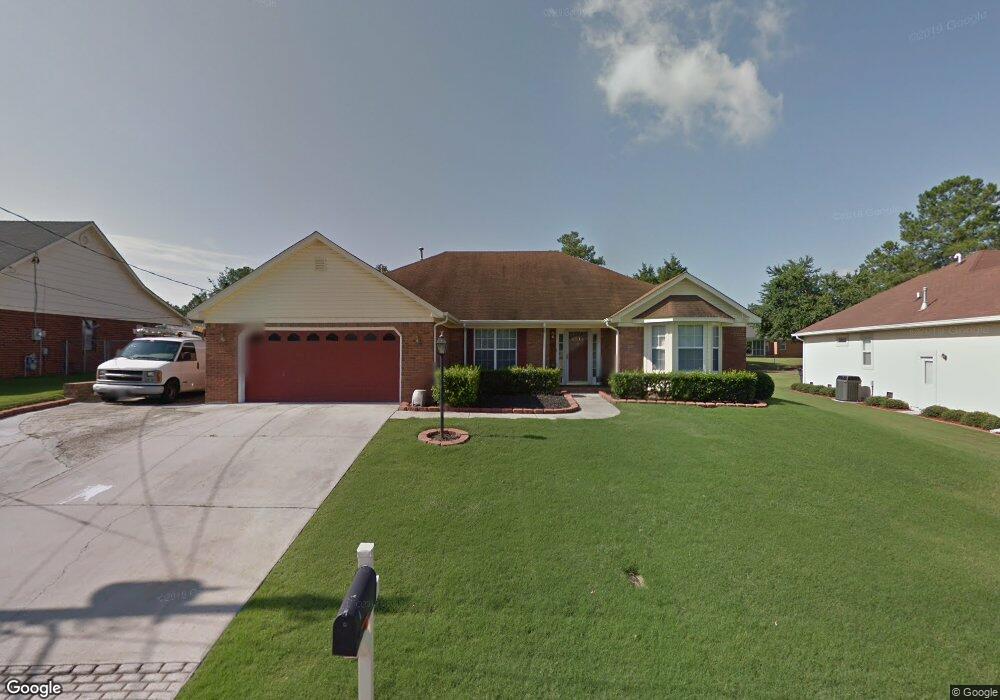
2912 Nells Ct Augusta, GA 30906
Barton Chapel NeighborhoodEstimated Value: $211,000 - $241,000
3
Beds
2
Baths
2,303
Sq Ft
$97/Sq Ft
Est. Value
About This Home
This home is located at 2912 Nells Ct, Augusta, GA 30906 and is currently estimated at $223,801, approximately $97 per square foot. 2912 Nells Ct is a home located in Richmond County with nearby schools including Glenn Hills Elementary School, Glenn Hills Middle School, and Johnson Magnet.
Ownership History
Date
Name
Owned For
Owner Type
Purchase Details
Closed on
Dec 6, 1995
Sold by
Lifsey Group Inc The
Bought by
Fuquay William Jr Fuquay Violet R
Current Estimated Value
Purchase Details
Closed on
Oct 27, 1995
Sold by
Lifsey Group Inc Th
Bought by
Fuquay William
Purchase Details
Closed on
Jul 18, 1994
Sold by
Nell Youngblood Builders Inc
Bought by
Fuquay William Jr Fuquay Volet R
Purchase Details
Closed on
Jul 14, 1994
Sold by
Nell Nell and Nell Youngblood Bui
Bought by
Fuquay William
Purchase Details
Closed on
Apr 22, 1994
Sold by
Lifsey Group Inc The
Bought by
Lifsey Group Inc The
Purchase Details
Closed on
Mar 21, 1994
Sold by
Lifsey Group Inc The
Bought by
Nell Youngblood Builders Inc
Purchase Details
Closed on
Mar 15, 1994
Sold by
Tucker Federal Sav
Bought by
Lifsey Group Inc Th
Purchase Details
Closed on
Sep 16, 1993
Sold by
Military Realty Inc L&D Properties Inc
Bought by
Lifsey Group Inc The
Create a Home Valuation Report for This Property
The Home Valuation Report is an in-depth analysis detailing your home's value as well as a comparison with similar homes in the area
Home Values in the Area
Average Home Value in this Area
Purchase History
| Date | Buyer | Sale Price | Title Company |
|---|---|---|---|
| Fuquay William Jr Fuquay Violet R | -- | -- | |
| Fuquay William | -- | -- | |
| Fuquay William Jr Fuquay Volet R | -- | -- | |
| Fuquay William | $105,900 | -- | |
| Lifsey Group Inc The | -- | -- | |
| Nell Youngblood Builders Inc | -- | -- | |
| Lifsey Group Inc Th | -- | -- | |
| Nell Nell | $14,000 | -- | |
| Lifsey Group Inc The | -- | -- |
Source: Public Records
Tax History
| Year | Tax Paid | Tax Assessment Tax Assessment Total Assessment is a certain percentage of the fair market value that is determined by local assessors to be the total taxable value of land and additions on the property. | Land | Improvement |
|---|---|---|---|---|
| 2025 | $470 | $91,388 | $7,600 | $83,788 |
| 2024 | $470 | $88,688 | $7,600 | $81,088 |
| 2023 | $406 | $76,896 | $7,600 | $69,296 |
| 2022 | $396 | $74,962 | $7,600 | $67,362 |
| 2021 | $396 | $58,157 | $7,600 | $50,557 |
| 2020 | $396 | $58,157 | $7,600 | $50,557 |
| 2019 | $396 | $58,157 | $7,600 | $50,557 |
| 2018 | $396 | $57,845 | $7,600 | $50,245 |
| 2017 | $340 | $57,845 | $7,600 | $50,245 |
| 2016 | $340 | $57,845 | $7,600 | $50,245 |
| 2015 | $340 | $54,816 | $7,600 | $47,216 |
| 2014 | $340 | $54,816 | $7,600 | $47,216 |
Source: Public Records
Map
Nearby Homes
- 2514 Lennys Dr
- 2714 Blossom Dr Unit A & B
- 2896 Rasha Dr
- 3602 Abbey Rd
- 2605 Hexe Ct
- 2621 Barton Chapel Rd
- 3427 Chadbourne St
- 2619 Drayton Dr
- 2603 Dublin Dr
- 3042 Johnny Ct
- 3703 Stockholm Dr
- 3031 Jeanne Rd
- 2965 Meadowbrook Dr
- 3011 Alene Ct
- 3415 Cauthen Dr
- 2532 Kensington Dr E
- 2811 Glenn Hills Dr
- 3010 Alene Ct
- 2870 Lumpkin Rd
- 2914 Cumberland Dr
Your Personal Tour Guide
Ask me questions while you tour the home.