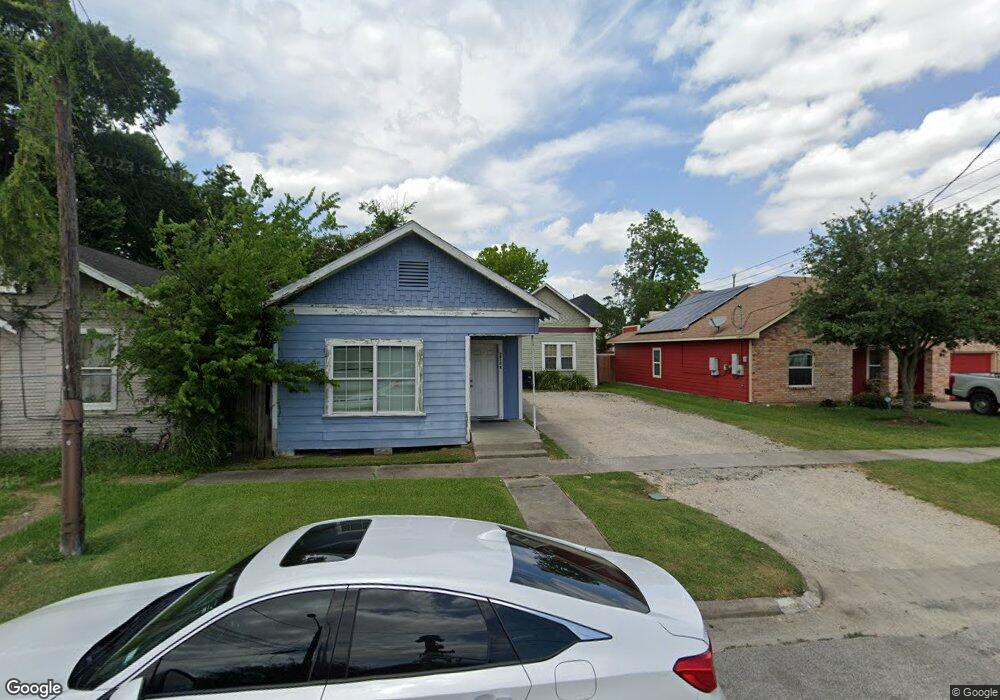
2912 Paige St Unit A,B,C Houston, TX 77004
Third Ward NeighborhoodEstimated Value: $139,000 - $260,000
--
Bed
2
Baths
2,032
Sq Ft
$102/Sq Ft
Est. Value
About This Home
This home is located at 2912 Paige St Unit A,B,C, Houston, TX 77004 and is currently estimated at $207,607, approximately $102 per square foot. 2912 Paige St Unit A,B,C is a home located in Harris County with nearby schools including Blackshear Elementary School, Cullen Middle School, and Yates High School.
Ownership History
Date
Name
Owned For
Owner Type
Purchase Details
Closed on
Aug 10, 2015
Sold by
Fannie Mae
Bought by
Gaytan Gerardo
Current Estimated Value
Purchase Details
Closed on
Mar 11, 2014
Sold by
Lea Brian E and Lea Margaret A
Bought by
Federal National Mortgage Association
Purchase Details
Closed on
Mar 2, 2006
Sold by
Bryant Albert Ray
Bought by
Lea Brian E and Lea Margaret A
Home Financials for this Owner
Home Financials are based on the most recent Mortgage that was taken out on this home.
Original Mortgage
$49,600
Interest Rate
6.05%
Mortgage Type
Purchase Money Mortgage
Purchase Details
Closed on
Feb 24, 2005
Sold by
Bayview Financial Property Trust
Bought by
Bryant Albert Ray
Purchase Details
Closed on
Aug 4, 1997
Sold by
Filippone Lena M and Filippone Maron J
Bought by
Scott Wizig Enterprises Inc
Create a Home Valuation Report for This Property
The Home Valuation Report is an in-depth analysis detailing your home's value as well as a comparison with similar homes in the area
Home Values in the Area
Average Home Value in this Area
Purchase History
| Date | Buyer | Sale Price | Title Company |
|---|---|---|---|
| Gaytan Gerardo | -- | None Available | |
| Federal National Mortgage Association | $84,784 | None Available | |
| Lea Brian E | -- | Texas American Title Company | |
| Bryant Albert Ray | -- | -- | |
| Scott Wizig Enterprises Inc | -- | Fidelity National Title |
Source: Public Records
Mortgage History
| Date | Status | Borrower | Loan Amount |
|---|---|---|---|
| Previous Owner | Lea Brian E | $49,600 |
Source: Public Records
Tax History Compared to Growth
Tax History
| Year | Tax Paid | Tax Assessment Tax Assessment Total Assessment is a certain percentage of the fair market value that is determined by local assessors to be the total taxable value of land and additions on the property. | Land | Improvement |
|---|---|---|---|---|
| 2025 | $5,102 | $138,829 | $77,880 | $60,949 |
| 2024 | $5,102 | $257,165 | $165,000 | $92,165 |
| 2023 | $5,102 | $203,219 | $165,000 | $38,219 |
| 2022 | $4,708 | $203,219 | $125,000 | $78,219 |
| 2021 | $3,407 | $146,168 | $125,000 | $21,168 |
| 2020 | $3,673 | $144,804 | $125,000 | $19,804 |
| 2019 | $3,405 | $128,723 | $110,000 | $18,723 |
| 2018 | $2,960 | $116,960 | $100,000 | $16,960 |
| 2017 | $3,092 | $116,960 | $100,000 | $16,960 |
| 2016 | $3,092 | $116,960 | $100,000 | $16,960 |
| 2015 | -- | $95,312 | $75,000 | $20,312 |
| 2014 | -- | $50,000 | $43,750 | $6,250 |
Source: Public Records
Map
Nearby Homes
- 2807 Delano St
- 2809 Tuam St
- 2805 Delano St
- 2804 Delano St Unit 4
- 2826 Drew St
- 3461 Drew St
- 2813 Drew St
- 3344 Sauer St
- 2724 Rosalie St
- 2710 Delano St
- 2701 Delano St
- 2604 Tuam St
- 2714 Nagle St
- 3229 Elgin St
- 2707 Dennis St
- 2709 Dennis St
- 3006 Dennis St
- 2708 Nagle St
- 3012, 3014, 3016 Rosalie St
- 3022 Drew St
- 2912 Paige St
- 2906 Paige St
- 2817 Anita St
- 2811 Anita St
- 2812 Tuam St
- 2908 Paige St
- 2902 Paige St
- 2902 Paige St
- 2813 Anita St Unit A
- 2813 Anita St
- 2819 Anita St
- 2809 Anita St
- 2807 Anita St
- 2907 Delano St Unit 1-6
- 2907 Delano St
- 2909 Delano St
- 2905 Delano St
- 2905 Delano St Unit 2
- 2805 Anita St
- 2824 Tuam St