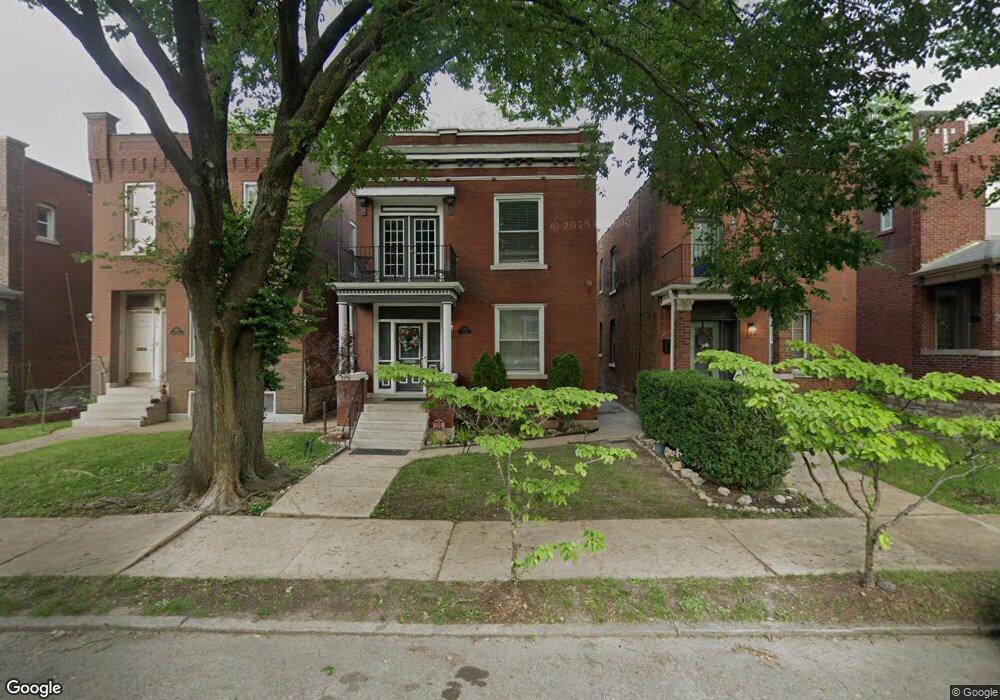
2912 S Compton Ave Saint Louis, MO 63118
Tower Grove East NeighborhoodEstimated Value: $266,000 - $447,000
3
Beds
3
Baths
2,380
Sq Ft
$148/Sq Ft
Est. Value
About This Home
This home is located at 2912 S Compton Ave, Saint Louis, MO 63118 and is currently estimated at $353,209, approximately $148 per square foot. 2912 S Compton Ave is a home located in St. Louis City with nearby schools including Shenandoah Elementary School, Long International Middle School, and Roosevelt High School.
Ownership History
Date
Name
Owned For
Owner Type
Purchase Details
Closed on
Jan 9, 2008
Sold by
Cullen Catherine and Hoel Christopher
Bought by
Cullen Catherine
Current Estimated Value
Purchase Details
Closed on
Apr 29, 2004
Sold by
Skyline By Design Inc
Bought by
Cullen Catherine F and Hoel Chris M
Home Financials for this Owner
Home Financials are based on the most recent Mortgage that was taken out on this home.
Original Mortgage
$184,635
Outstanding Balance
$85,836
Interest Rate
5.38%
Mortgage Type
Purchase Money Mortgage
Estimated Equity
$267,373
Purchase Details
Closed on
Apr 22, 2003
Sold by
Piles Ken
Bought by
Skyline By Design Inc
Purchase Details
Closed on
Jul 9, 2001
Sold by
Mcnamara Mark
Bought by
Piles Ken
Purchase Details
Closed on
Mar 14, 2000
Sold by
Mcnamara Jack
Bought by
Mcnamara Mark and Piles Ken
Create a Home Valuation Report for This Property
The Home Valuation Report is an in-depth analysis detailing your home's value as well as a comparison with similar homes in the area
Home Values in the Area
Average Home Value in this Area
Purchase History
| Date | Buyer | Sale Price | Title Company |
|---|---|---|---|
| Cullen Catherine | -- | None Available | |
| Cullen Catherine F | -- | -- | |
| Skyline By Design Inc | -- | -- | |
| Piles Ken | -- | -- | |
| Mcnamara Mark | -- | -- |
Source: Public Records
Mortgage History
| Date | Status | Borrower | Loan Amount |
|---|---|---|---|
| Open | Cullen Catherine F | $184,635 | |
| Closed | Cullen Catherine F | $32,500 |
Source: Public Records
Tax History
| Year | Tax Paid | Tax Assessment Tax Assessment Total Assessment is a certain percentage of the fair market value that is determined by local assessors to be the total taxable value of land and additions on the property. | Land | Improvement |
|---|---|---|---|---|
| 2025 | $4,109 | $53,900 | $1,960 | $51,940 |
| 2024 | $3,908 | $48,750 | $1,960 | $46,790 |
| 2023 | $3,908 | $48,750 | $1,960 | $46,790 |
| 2022 | $3,644 | $43,740 | $1,960 | $41,780 |
| 2021 | $3,638 | $43,740 | $1,960 | $41,780 |
| 2020 | $3,387 | $41,010 | $1,960 | $39,050 |
| 2019 | $3,374 | $41,010 | $1,960 | $39,050 |
| 2018 | $2,962 | $34,850 | $1,960 | $32,890 |
| 2017 | $2,912 | $34,850 | $1,960 | $32,890 |
| 2016 | $1,652 | $19,380 | $1,960 | $17,420 |
| 2015 | $1,499 | $19,380 | $1,960 | $17,420 |
| 2014 | $1,453 | $19,380 | $1,960 | $17,420 |
| 2013 | -- | $18,790 | $1,960 | $16,830 |
Source: Public Records
Map
Nearby Homes
- 3002 S Compton Ave
- 3005 S Compton Ave
- 2908 Michigan Ave
- 3000 Louisiana Ave
- 3125 Michigan Ave
- 3118 Magnolia Ave
- 3142 Michigan Ave
- 3147 Michigan Ave
- 3215 Magnolia Ave
- 2641 Minnesota Ave
- 2619 Michigan Ave
- 3406 Juniata St
- 2626 Minnesota Ave
- 2901 Magnolia Ave
- 2632 Tennessee Ave
- 3430 Juniata St
- 2630 Tennessee Ave
- 3150 Nebraska Ave
- 3521 Hartford St
- 2646 Nebraska Ave
- 2910 S Compton Ave
- 2904 S Compton Ave
- 2914 S Compton Ave
- 2914 S Compton Ave
- 2900 S Compton Ave
- 2900 S Compton Ave Unit 2900A
- 2900 S Compton Ave Unit 2900-2902
- 2916 S Compton Ave
- 2916 S Compton Ave
- 2916 S Compton Ave Unit 2916
- 2916 S Compton Ave Unit 2918
- 2918 S Compton Ave
- 2918 S Compton Ave
- 2922 S Compton Ave
- 2915 Michigan Ave
- 2926 S Compton Ave
- 2907 Michigan Ave
- 2907 Michigan Ave
- 2917 Michigan Ave
- 3200 Pestalozzi St
Your Personal Tour Guide
Ask me questions while you tour the home.