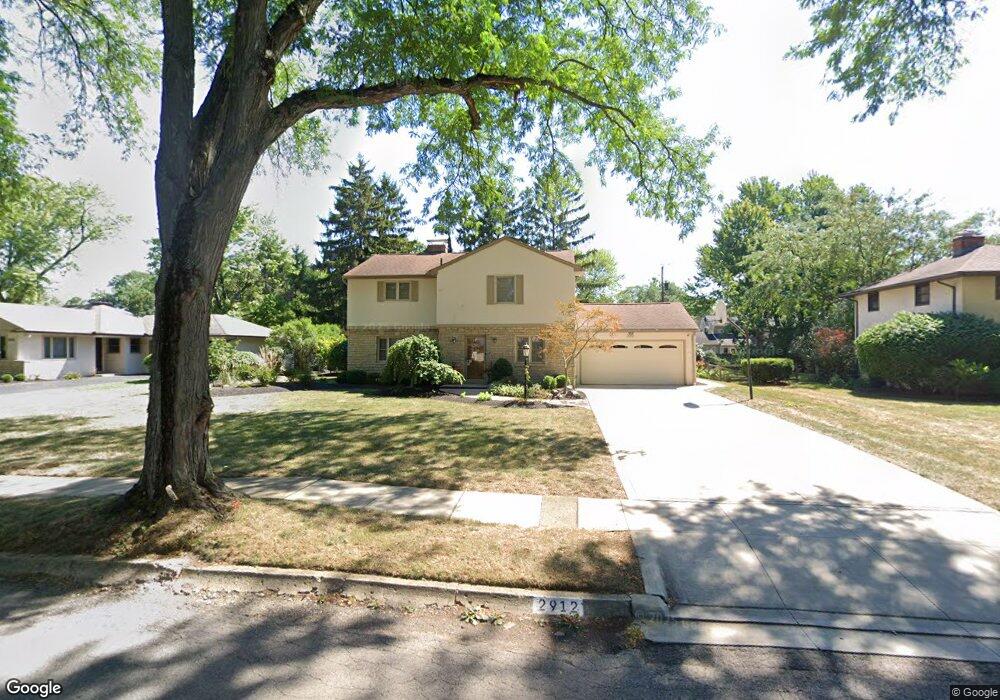
2912 Wellesley Dr Columbus, OH 43221
Estimated Value: $735,203 - $895,000
4
Beds
3
Baths
2,516
Sq Ft
$329/Sq Ft
Est. Value
About This Home
This home is located at 2912 Wellesley Dr, Columbus, OH 43221 and is currently estimated at $828,801, approximately $329 per square foot. 2912 Wellesley Dr is a home located in Franklin County with nearby schools including Tremont Elementary School, Jones Middle School, and Upper Arlington High School.
Ownership History
Date
Name
Owned For
Owner Type
Purchase Details
Closed on
Dec 22, 2010
Sold by
Kaumeyer Dean A and Kaumeyer Beth M
Bought by
Crossley Burkholder Joshua David and Crossley Burkholder Suzanne
Current Estimated Value
Home Financials for this Owner
Home Financials are based on the most recent Mortgage that was taken out on this home.
Original Mortgage
$334,450
Outstanding Balance
$220,289
Interest Rate
4.16%
Mortgage Type
New Conventional
Estimated Equity
$608,512
Purchase Details
Closed on
May 31, 2002
Sold by
Faehnle Carl J and Faehnle Judith B
Bought by
Kaumeyer Dean A and Kaumeyer Beth M
Purchase Details
Closed on
May 17, 1979
Bought by
Faehnle Carl J
Create a Home Valuation Report for This Property
The Home Valuation Report is an in-depth analysis detailing your home's value as well as a comparison with similar homes in the area
Home Values in the Area
Average Home Value in this Area
Purchase History
| Date | Buyer | Sale Price | Title Company |
|---|---|---|---|
| Crossley Burkholder Joshua David | $371,000 | Talon Group | |
| Kaumeyer Dean A | $300,000 | Chicago Title | |
| Faehnle Carl J | $83,300 | -- |
Source: Public Records
Mortgage History
| Date | Status | Borrower | Loan Amount |
|---|---|---|---|
| Open | Crossley Burkholder Joshua David | $334,450 |
Source: Public Records
Tax History Compared to Growth
Tax History
| Year | Tax Paid | Tax Assessment Tax Assessment Total Assessment is a certain percentage of the fair market value that is determined by local assessors to be the total taxable value of land and additions on the property. | Land | Improvement |
|---|---|---|---|---|
| 2024 | $11,108 | $191,870 | $67,900 | $123,970 |
| 2023 | $11,369 | $191,870 | $67,900 | $123,970 |
| 2022 | $12,220 | $167,510 | $51,030 | $116,480 |
| 2021 | $10,375 | $167,510 | $51,030 | $116,480 |
| 2020 | $10,284 | $167,510 | $51,030 | $116,480 |
| 2019 | $9,570 | $138,010 | $51,030 | $86,980 |
| 2018 | $9,344 | $138,010 | $51,030 | $86,980 |
| 2017 | $9,497 | $138,010 | $51,030 | $86,980 |
| 2016 | $9,159 | $138,530 | $36,820 | $101,710 |
| 2015 | $9,151 | $138,530 | $36,820 | $101,710 |
| 2014 | $9,162 | $138,530 | $36,820 | $101,710 |
| 2013 | $4,375 | $125,930 | $33,460 | $92,470 |
Source: Public Records
Map
Nearby Homes
- 3156 Mt Holyoke Rd
- 3015 Welsford Rd
- 2648 Chester Rd
- 1111 Sunny Hill Dr
- 1098 Stanhope Dr
- 2569 Chester Rd
- 2615 Northwest Blvd
- 1909 Inchcliff Rd
- 1887-1891 Kentwell Rd
- 3106 Somerford Rd
- 965 Manor Ln Unit W
- 2027-2033 Ridgeview Rd
- 1767 Riverhill Rd
- 1565 Berkshire Rd
- 3296 Leighton Rd
- 1980 W Lane Ave
- 3526 Rue de Fleur Unit B18U
- 1535 Doone Rd
- 1481 Doone Rd
- 2227 Zollinger Rd
- 2900 Wellesley Dr
- 2924 Wellesley Dr
- 2905 Halstead Rd
- 2917 Halstead Rd
- 2895 Halstead Rd
- 2936 Wellesley Dr
- 2890 Wellesley Dr
- 2915 Wellesley Dr
- 2903 Wellesley Dr
- 2925 Wellesley Dr
- 2927 Halstead Rd
- 2883 Halstead Rd
- 2937 Wellesley Dr
- 2891 Wellesley Dr
- 2946 Wellesley Dr
- 2878 Wellesley Dr
- 2939 Halstead Rd
- 2871 Halstead Rd
- 2914 Mount Holyoke Rd Unit 916
- 2924 Mount Holyoke Rd Unit 926