Estimated Value: $156,714 - $192,000
Studio
1
Bath
962
Sq Ft
$180/Sq Ft
Est. Value
About This Home
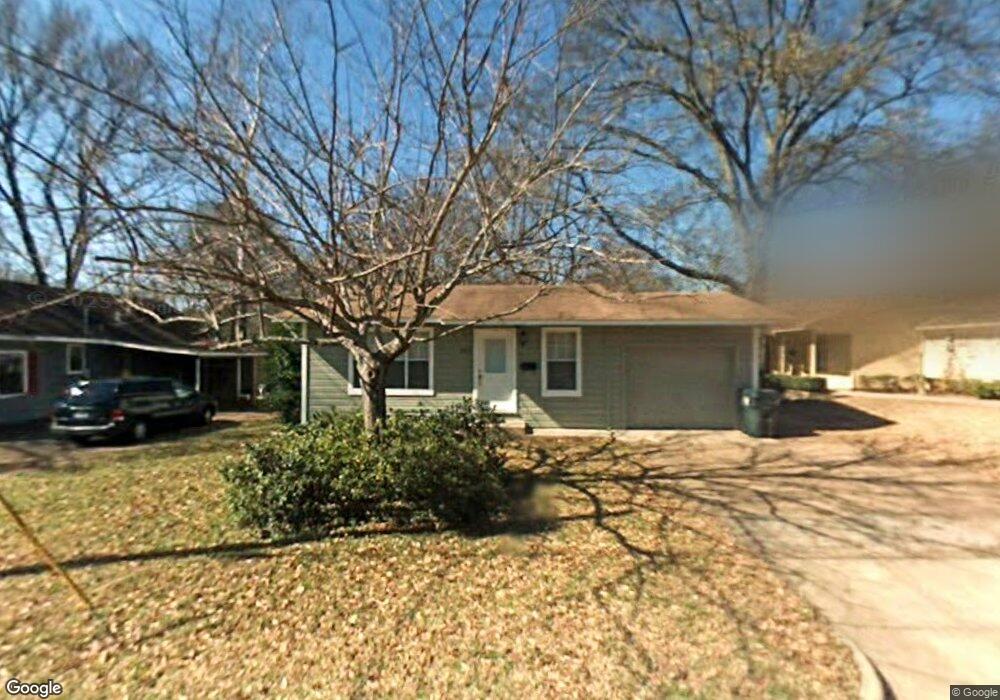
This home is located at 2913 Crestview St, Tyler, TX 75701 and is currently estimated at $172,905, approximately $179 per square foot. 2913 Crestview St is a home located in Smith County with nearby schools including Woods Elementary School, Hubbard Middle School, and Tyler Legacy High School.
Ownership History
Date
Name
Owned For
Owner Type
Purchase Details
Closed on
Feb 23, 2023
Sold by
Ryan Lisa A Orsino
Bought by
Martinez Victor Andre
Current Estimated Value
Home Financials for this Owner
Home Financials are based on the most recent Mortgage that was taken out on this home.
Original Mortgage
$96,000
Outstanding Balance
$92,882
Interest Rate
6.33%
Mortgage Type
New Conventional
Estimated Equity
$80,023
Purchase Details
Closed on
Jun 29, 2005
Sold by
Secretary Of Housing & Urban Development
Bought by
Ryan Lisa A Orsino
Home Financials for this Owner
Home Financials are based on the most recent Mortgage that was taken out on this home.
Original Mortgage
$38,142
Interest Rate
5.67%
Mortgage Type
New Conventional
Purchase Details
Closed on
Nov 2, 2004
Sold by
Mortgage Electronic Registration Systems
Bought by
Secretary Of Housing & Urban Development
Create a Home Valuation Report for This Property
The Home Valuation Report is an in-depth analysis detailing your home's value as well as a comparison with similar homes in the area
Purchase History
| Date | Buyer | Sale Price | Title Company |
|---|---|---|---|
| Martinez Victor Andre | -- | -- | |
| Ryan Lisa A Orsino | -- | None Available | |
| Secretary Of Housing & Urban Development | -- | None Available | |
| Secretary Of Housing & Urban Development | -- | None Available |
Source: Public Records
Mortgage History
| Date | Status | Borrower | Loan Amount |
|---|---|---|---|
| Open | Martinez Victor Andre | $96,000 | |
| Previous Owner | Ryan Lisa A Orsino | $38,142 |
Source: Public Records
Tax History
| Year | Tax Paid | Tax Assessment Tax Assessment Total Assessment is a certain percentage of the fair market value that is determined by local assessors to be the total taxable value of land and additions on the property. | Land | Improvement |
|---|---|---|---|---|
| 2025 | $2,683 | $157,728 | $30,528 | $127,200 |
| 2024 | $2,399 | $140,986 | $12,000 | $128,986 |
| 2023 | $2,054 | $117,812 | $12,000 | $105,812 |
| 2022 | $1,641 | $83,758 | $10,960 | $72,798 |
| 2021 | $1,310 | $62,453 | $10,960 | $51,493 |
| 2020 | $1,413 | $66,032 | $10,960 | $55,072 |
| 2019 | $1,419 | $64,894 | $10,960 | $53,934 |
| 2018 | $1,272 | $58,481 | $8,000 | $50,481 |
| 2017 | $1,249 | $58,481 | $8,000 | $50,481 |
| 2016 | $1,203 | $56,348 | $8,000 | $48,348 |
| 2015 | $1,181 | $56,973 | $8,000 | $48,973 |
| 2014 | $1,181 | $55,587 | $8,000 | $47,587 |
Source: Public Records
Map
Nearby Homes
- 2916 Crestview Ave
- 2904 New Copeland Rd
- 611 E Watkins St
- 3126 Colgate Ave
- 317 Amberwood Cir
- 414 Wilma St
- 3140 Bracken Dr
- 921 E Barbara St
- 309 Glenhaven Dr
- 901 Rhodes Dr
- 3432 New Copeland Rd
- 1018 Pollard Dr
- 3828 Cr 219
- 1101 Clyde Dr
- 3528 New Copeland Rd
- 2917 Sunnybrook Dr
- 1100 E Amherst Dr
- 2521 Pounds Ave
- 2319 Pollard Dr
- 1126 Pollard Dr
- 2909 Crestview St
- 2917 Crestview St
- 2903 Crestview St
- 2925 Crestview St
- 2914 S Donnybrook Ave
- 2901 Crestview St
- 2906 S Donnybrook Ave
- 2929 Crestview St
- 2916 2916 Crestview
- 2920 S Donnybrook Ave
- 2900 S Donnybrook Ave
- 2926 2926 Crestview
- 2833 Crestview St
- 2914 Crestview St
- 2916 Crestview St
- 3001 Crestview St
- 2912 Crestview St
- 2832 S Donnybrook Ave
- 2926 Crestview St
- 2930 S Donnybrook Ave
Your Personal Tour Guide
Ask me questions while you tour the home.